Inspirational journeys
Follow the stories of academics and their research expeditions
Power BI Interview Questions and Answers (UPDATED)

Introduction
Most Commonly Asked Power BI Interview Questions And Answers 2024
The Microsoft Power BI reporting certification course can help you develop important dashboards from reports, data, and other resources. Power BI Interview questions will help you make a good impression in your interview and get the most out of your knowledge.
Power BI is a Microsoft Initiative that came into effect in 2013. Power BI can be considered a completely separate tool that is more powerful and useful than the individual Microsoft Office tools. Most of Microsoft’s growth and increase in customer base are only possible through Power BI.
Moving to Power BI can greatly improve your performance at work and in other areas. You can use Power BI to use Excel, data models, and business reports to create a comprehensive dashboard that will help you quickly analyze, publish, and extract information.
Top Power BI Interview questions are asked by recruiters to test your knowledge in that specific field. These top Power BI interview questions are frequently asked and advantageous for interview preparation.
We have curated lists of advanced Power BI interview questions and answers in this article. By strategizing your goals, you can get a good idea of scenario-based Power BI interview questions and answers.
Best Power BI Interview Questions And Answers
The top Power BI interview questions and answers will help you prepare better for your interview, as these are very likely to be asked. Industry experts recommend going through these questions, which will help a candidate significantly in his or her interview.
There are many categories of Power BI interview questions. These different categories will help you understand and analyze the scenario-based Power BI interview questions and answers.
General Power BI Interview Questions and Answers – Set 1

1) What are the different components of Microsoft BI solutions?
There are two components to the Microsoft BI self-service. These two parts are the Excel BI Toolkit and Power BI. The Excel BI toolkit uses Microsoft Excel tools to create reports by using data from various sources and using them to create various data models.
On the other hand, Power BI is a completely online tool and takes help from queries that have been created using the previous toolkit, i.e., the Excel BI Toolkit.
2) What do you mean by self-service Business intelligence, or SSBI?
SSBI is a unique system of data analysis that will help businesses filter and analyze data without going into detail about the methods of statistical analysis, or BI.
As a result, users now find it easy to use and access data to create helpful models and get better insights.
Thus, users don’t need a deeper understanding to carry out their data processing tasks. Any user with just a basic level of understanding will be able to build interactive and responsive dashboards.
3) Give a brief overview of Power BI.
Power BI is an advanced cloud-based data sharing platform by Microsoft that helps users create a multi-dimensional dashboard using reports developed through tools like Power View, Power Query, and Power Pivot. As a result, users will be able to share the dashboard data with their clients, colleagues, management, or any other group of people.
With the help of Power BI, users can now upload their Excel sheets to the cloud and make them easier to access by people with whom they want to share them. Power BI gives users the flexibility to choose a limited number of co-workers with whom to share the data.
Apart from that, the chosen people can also apply their modifications to the shared Excel workbooks and add their highlights or comments. Thus, Power BI is a simple way to share and analyze data without going through multiple platforms.
Microsoft Cloud helps you coalesce all the data in one place and access it later.
There are many useful features in Power BI, such as sharing presentations with colleagues, co-workers, etc. Users can even update their Excel sheets using the data present on the site itself or in the cloud.
It also supports sharing from multiple devices like PCs, laptops, and smartphones. There is a Power BI application for mobile devices that allows users to access Power BI from their mobile phones. Also, users can query their data using natural language processing.
4) Give an idea about Power BI Desktop.
Power BI Desktop is software made for computers. Users can install the software directly on their PCs and laptops. There are many functions that users can do with the help of Power BI software, like data exploration, modeling, etc.
You can even create reports and publish them on the cloud system. That data can be accessed by anyone with the same software. There is also the option of saving the work on-site and sharing it with others.
5) Which sources of data can you connect Power BI with?
There are mainly three types of data sources that you can connect with Power BI. These are as follows:
Files: Data formats in the form of Excel, Power BI files, and CSV
Content Packs: A content pack consists of files and data that are placed as part of the same group. There are several service providers, like Google Analytics and Marketo, that will help users share and organize their work.
Connectors: These are pieces of software that connect with databases like Azure. With the help of connectors, users will be able to seamlessly transfer their data to different platforms.
6) What are the various forms of building blocks in Power BI?
There are five types of building blocks that form the main component of Power BI.
- Visualization: The representation of values and data in the form of pie charts, graphs, bars, maps, etc. is known as visualization.
- Datasets: The collection of data that users can use to create various visualizations is known as a dataset. The major examples of datasets are Excel sheets, Oracle tables, and SQL Server tables.
- Reports: Data that can appear on one or more pages is known as a report. There can be several types of reports, such as sales reports, logistics reports, performance reports, etc.
- Dashboard: A dashboard is like a single layer of visualization or multiple layers of visualization. Users have the option of integrating various types of visualizations into one format. An example of a dashboard includes pie charts, geographical maps, and bar charts.
- Tiles: Every report has one or more slides that display some specific data in a specific dashboard that is a part of another report. Such slides are known as tiles.
7) Name the types of filters in Power BI reports.
There are various levels of filters in a Power BI report. These filters are visual filters, page filters, report filters, etc. The visual filters are used to reduce the amount of data that can be seen in the report. The visual filters can work for both data and calculations.
Then there are the report-level filters. These report-level filters function for the whole report to filter its content and include only the relevant data in the final report.
Power BI Interview Questions and Answers – Set 2

8) What are the various components of the distinction in report publishing capacities between utilizing a live or direct question association, for example, to an Analysis Services model, compared with working with an information model nearby to the Power BI Desktop record?
With an information model nearby the PBIX document or Power Pivot exercise manual, the creator has full authority over the inquiries, the demonstrations or connections, the metadata, and the measurements.
With a live association with an Analysis Services information base, the client can't make new measurements, import new information, or change the categorization of the measurements.
9) What are the alternatives for three Edit Interactions on a visual tile in Power BI Desktop?
The three alternative communication alternatives are Filter, Highlight, and None.
Channel:
It channels a visual dependent on the channel choice of another visual or tile.
Feature:
It features just the connected components on the screen, dimming out the non-related things.
None:
It overlooks the channel choice of another visual.
10) What are the contrasts or differences between Power BI, Report, and Dashboard?
Dataset:
The source used to make reports and visuals is an information model (nearby to PBIX or XLSX) or a model in an Analysis Services Server. Information could be within the model (imported) or in a Direct Query association with a source.
Report:
An individual Power BI Desktop document (PBIX) containing at least one report page. Worked for a profound, intelligent examination experience for given dataset channels and arrangements.
Each Report is associated with at least one dataset. Each page contains at least one visual or tile.
Dashboard:
It is an assortment of visuals or infographics from published datasets. A dashboard displays all essential visuals and measurements from different datasets in one place.
11) How is information security executed in Power BI?
Power BI can apply row-level security to models. A DAX articulation is applied to a table, sifting its columns at question time. Dynamic security includes the utilization of USERNAME capacities in security job definitions.
Normally, a table is made in the model that relates clients to explicit measurements and a job.
12) What are many-to-numerous connections, and how might they be tended to in Power BI?
Many-to-many connections include a scaffold or intersection table mirroring the blends of two measurements (for example, specialists and patients).
Either all potential blends or those mixes that have happened Bi-Directional cross-filtering connections can be utilized in PBIX. CROSSFILTER capacity can be utilized in Power Pivot for Excel. DAX can be utilized per metric to check and, alternatively, adjust the channel setting.
13) What is the Power BI Publisher for Excel?
The Power BI publisher for Excel works smoothly with Microsoft Excel to help users prepare graphs, charts, and other datasets.
After creating such datasets, users will be able to share their Excel workbooks and files on the cloud.
After sharing in the cloud, only people with the required permissions can access the stores' files. It uses software like Microsoft Azure to sync information to various devices and make them accessible to different people.
14) What is Power BI Q&A?
Power BI Q&A is a characteristic language apparatus that helps you question your information and get the outcomes you need from it. You do this by composing an answer into an exchange box on your Dashboard, which the motor momentarily produces, like Power View.
Questions and answers decipher your inquiries and show you a rehashed inquiry of what it is looking for from your information. Questions and answers were created by Server and Tools, Microsoft Research, and the Bing groups to give you the feeling that they are genuinely investigating your information.
15) What is the designer software for Power BI?
It is an independent application where we can make Power BI reports and afterward transfer them to Powerbi.com, and it doesn't need Excel. It is a mix of Power Query, Power Pivot, and Power View.
16) Can you retrieve your Power BI information after uploading it to the cloud services?
Yes, we can invigorate our reports through the Data Management gateway and the Power BI Personal gateway.
Power BI Interview Questions and Answers – Set 3

17) What are the various sorts of reviving information for our distributed reports?
There are four primary kinds of reviving in Power BI. Bundle invigorate, model or information revive, tile revive, and visual compartment revive.
Bundle invigorate:
This synchronizes your Power BI Desktop, or Excel, document between the Power BI administration and OneDrive, or SharePoint Online. Notwithstanding, this doesn't pull information from the first information source. The dataset in Power BI may be refreshed with what is in the document inside OneDrive or SharePoint Online.
Model/information invigorates:
It refers to invigorating the dataset inside the Power BI administration with information from the first information source. This is finished by either utilizing planned revitalization or invigorating now. This requires an entryway for on-premises information sources.
Visual revive:
Visual Invigorate refreshes the reserve for tile visuals on the dashboard when information changes. This occurs like clockwork. You can likewise drive a tile to refresh by choosing the ellipsis in the upper right of a dashboard and choosing Refresh dashboard tiles.
Visual compartment revive
Invigorating the visual holder refreshes the reserved report visuals inside a report when the information changes. To find out about information revitalization and see how to actualize it, check out the accompanying connection.
18) Can users access Power BI on the premises themselves?
No, Power BI isn't accessible as a private, internal cloud administration. In any case, with Power BI and Power BI Desktop, you can safely associate your on-premises information sources.
With the On-premises Data Gateway, you can associate live with your on-premises SQL Server Analysis Services and other information sources.
You can likewise plan to revive with a unified door. If a passage isn't accessible, you can invigorate information from on-premises information sources utilizing the Power BI Gateway Personal.
19) What are the information hotspots for the Power Map?
The information can either be available in Excel or remotely. To set up your information, ensure the entirety of the information is in the Excel table arrangement, where each column speaks to a special record.
Your section headings or line headings ought to contain text rather than real information so that Power Map will decipher them effectively when it plots the geographic directions.
Utilizing important marks likewise makes value and class fields accessible to you when you plan your visit in the Power Map Tour Editor sheet.
To utilize a table structure that all the more precisely speaks to time and geology inside Power Map, remember the entirety of the information for the table lines and utilize illustrative content names in the section headings.
20) Which language is utilized in Power Query?
Another programming language utilized in power inquiries is called M-Code. It is anything but difficult to utilize, and I like different dialects. M-code is a touchy language.
21) For what reason do we need Power Query in place of Power Pivot?
Power Query is a self-administration ETL instrument that stands for Extract, Transform, and Load and runs as an Excel include. It permits clients to pull information from different sources, control said information into a structure that suits their requirements, and load it into Excel.
It is generally ideal to utilize Power Query over Power Pivot, as it lets you load the information as well as control it according to the clients' needs while stacking.
22) What is the Power Map?
Power Map is an Excel feature that gives you a powerful arrangement of instruments to assist you with picturing and increasing your understanding of huge arrangements of information that have a geo-coded part.
It can assist you with creating 3D representations by plotting up to 10,000,000 information focuses, such as section, warmth, and air pocket maps, on the head of a Bing map.
If the information is time-stepped, it can likewise create intelligent perspectives that show how the information changes over time.
23) What is an inquiry collapsing in Power Query?
Query collapsing is when steps characterized in Power Query or Query Editor are converted into SQL and executed by the source information base instead of the customer machine.
It's significant for preparing execution and versatility, given the restricted assets on the customer machine.
Power BI Interview Questions and Answers – Set 4

24) Can SQL, Power Query, and the Query Editor be utilised together?
Yes, a SQL proclamation can be characterised as the wellspring of a Power Query and M work for extra preparation and rationale.
This would be a decent practise to guarantee that a proficient information-base inquiry is passed to the source and evade superfluous preparation and unpredictability by the customer machine and M work.
25) Would we be able to have more than one dynamic connection between two tables in the information model of power rotation?
No, we can't have more than one dynamic connection between two tables. Notwithstanding, there can be more than one connection between two tables; however, there will be just one dynamic relationship and numerous dormant relationships.
The dabbed lines are idle, and the consistent lines are dynamic.
26) What is a power pivot?
Power Pivot is an included feature for Microsoft Excel 2010 that empowers you to import a great many columns of information from various information sources into a single Excel exercise manual.
It lets you make connections between heterogeneous information, determine segments and measures utilising recipes, and assemble PivotTables and PivotCharts.
You would then be able to additionally dissect the information so you can settle on opportune business choices without requiring IT help.
27) What is the Power Pivot Data Model?
It is a model that is comprised of information types, tables, segments, and table relations. These information tables are normally developed for holding information for a business substance.
28) How can you use the different content packs in Power BI?
Different Content packs are prefabricated answers for well-known administrations as a feature of the Power BI experience. An endorser of an upheld administration can rapidly interface with their record from Power BI to see their information through live dashboards and intelligent reports that have been pre-worked for them.
Microsoft has delivered content packs for famous administrations, for example, Marketo, Adobe Analytics, Azure Mobile Engagement, CircuitID, comScore Digital Analytix, Quickbooks Online, and TyGraph.
These organisations take help from Microsoft software and tweak it with their own modifications to get the most out of technology. Apart from that, there are other packs, like the authoritative substance packs.
These Authoritative substance packs are highly beneficial for clients and organisations. Authoritative substance packs give clients, BI experts, and framework integrators the instruments to assemble their substance packs with common software developed inside their association.
Power BI Interview Questions and Answers For Experienced – Set 5

29) Mention important components of SSAS.
Given below are some of the important Components of SSAS:
OLAP Engine
An OLAP Engine is used to allow fast ad-hoc queries at a fast pace for end users.
Data Drilling
It refers to the process of going down a level of hierarchy to explore the details of the data.
Slicers
Data slicing refers to the process of placing data in rows and columns.
Pivoting
Pivoting refers to the process of switching categories of data between rows and columns.
30) What are the different stages in the workings of Power BI?
Given below are the three different stages of working on Power BI:
- Data Integration
- Data Processing
- Data Presentation
31) Name the variety of Power BI Formats.
Power BI is mainly available in three formats, as listed below:
- Power BI Desktop: An Open-Source Version for Desktop Users
- Power BI Services: For Online Services
- Power BI Mobile Application: Compatible with Mobile Devices
Advanced Power BI Interview Questions And Answers – Set 6

32) What is the xVelocity in-memory investigation motor utilised in the Power Pivot?
The fundamental motor behind the power turn is the xVelocity in-memory examination motor. It can deal with a huge amount of information since it stores it in columnar information bases and uses in-memory investigation, which brings about quicker handling of information as it stacks all information in RAM.
33) What are the most common data-shaping techniques?
The most common data-shaping techniques involve:
- Removing Columns and Rows
- Adding an Index
- Applying for a Sort Order
- To create custom columns
- Pivoting Columns
- Grouping Rows
34) What is z-order in Power BI?
Z-order refers to the design choice used for presenting visuals over shapes. It is a method to apply to reports with multiple elements as well as to refresh the display after a report has multiple elements.
Favor the Interview
Power BI in learning data analytics is beneficial, and its features involve unlimited access to on-premise and in-cloud data, stunning visualizations shareable with wide audiences, a robust collection of learning materials, and solutions to complex questions.
As previously discussed, the above list of Power BI interview questions and answers for experienced or fresher’s will enhance the interview process even better. Power BI is utilized for managing all the facets of a company. Professionals can easily crack related interviews remarkably with the latest Power BI interview questions and answers for experienced candidates, as mentioned above.
If you seek to acquire skills and learning with business analytics, register with Sprintzeal and explore the Business Analytics certification course.
If you have queries for "Power BI Interview Questions and Answers 2024" or the certification course, do reach us in the comment section provided below.

Recommended Read:
Data Visualization – Benefits and Tools
Data Science Interview Questions and Answers
If you are aspiring to make a career in data handling, getting the Big Data Certification is a great option to gain knowledge and skills in the field. It is an industry-recognized certification with huge demand in the market. Another popular one is Big Data, Hadoop, and Spark developer certification.
To explore more career-making courses, you can visit Sprintzeal's All Courses and for any course-related queries, you can chat with the course experts and find the training/certification that will benefit your career.
Table of Contents
- Most Commonly Asked Power BI Interview Questions And Answers 2026
- Best Power BI Interview Questions And Answers
- General Power BI Interview Questions and Answers – Set 1
- Power BI Interview Questions and Answers – Set 2
- Power BI Interview Questions and Answers – Set 3
- Power BI Interview Questions and Answers – Set 4
- Power BI Interview Questions and Answers For Experienced – Set 5
- Advanced Power BI Interview Questions And Answers – Set 6
- Technical Based Power BI Interview Question and Answers – Set 7
- Tips to Ace the Power BI Interview
Most Commonly Asked Power BI Interview Questions And Answers 2026
Power BI is a Microsoft initiative that came into effect in 2013. Power BI can be considered a completely separate tool that is more powerful and useful than the individual Microsoft Office tools. Most of Microsoft’s growth and increase in customer base is only possible through Power BI. Microsoft Power BI is one of the most popular business intelligence tools today because most IT businesses utilize it for business analytics.
Power BI skills are crucial for modern business intelligence and data analysis roles, enabling professionals to transform raw data into actionable insights through interactive reports and visualizations, boosting efficiency and competitiveness in data-centric environments. Moving to Power BI can greatly improve your performance at work and in other areas. You can use Power BI to use Excel, data models, and business reports to create a comprehensive dashboard that will help you quickly analyze, publish, and extract information.
Top Power BI Interview Questions are asked by recruiters to test your technical knowledge and problem-solving skills in data visualization, reporting, and analytics. Mastering these questions helps you demonstrate your expertise and stand out as a qualified candidate for business intelligence roles. These top Power BI questions are frequently asked and advantageous for interview preparation.
We have curated lists of advanced Power BI interview questions and answers in this article. By strategizing your goals, you can get a good idea of Power BI scenario-based interview questions and answers.
Best Power BI Interview Questions And Answers
The top Power BI interview questions and answers will help you prepare better for your interview, as these are very likely to be asked. Industry experts recommend going through these questions, which will help a candidate significantly in his or her interview.
There are many categories of Power BI interview questions for experienced professionals, ranging from basic interview questions on Power BI to advanced Power BI scenario-based interview questions and answers. These different categories will help you understand and analyze how to approach real-world business challenges using Power BI tools. Practicing these will ensure you're well-prepared to tackle both theoretical and practical questions.
In addition, going through Power BI developer interview questions will give you an extra edge in understanding more technical and role-specific questions. These Power BI developer interview questions, developer-focused questions, will prepare you to handle the more complex aspects of Power BI development and how to apply your skills in real-world business environments.
General Power BI Interview Questions and Answers – Set 1
1) What are the different components of Microsoft BI solutions?
There are two components to the Microsoft BI self-service. These two parts are the Excel BI Toolkit and Power BI. The Excel BI toolkit uses Microsoft Excel tools to create reports by using data from various sources and using them to create various data models.
On the other hand, Power BI is a completely online tool and takes help from queries that have been created using the previous toolkit, i.e., the Excel BI Toolkit.
2) What do you mean by self-service business intelligence, or SSBI?
SSBI is a unique system of data analysis that will help businesses filter and analyze data without going into detail about the methods of statistical analysis, or BI.
As a result, users now find it easy to use and access data to create helpful models and get better insights. It simplifies the data exploration process, allowing users with basic knowledge to independently perform data processing and make data-driven decisions.
Thus, users don’t need a deeper understanding to carry out their data processing tasks. Any user with just a basic level of understanding will be able to build interactive dashboards and gain valuable insights from data without relying on IT teams or data analysts.
3) Give a brief overview of Power BI.
Power BI is an advanced cloud-based data sharing platform by Microsoft that helps users create a multi-dimensional dashboard using reports developed through tools like Power View, Power Query, and Power Pivot. As a result, users will be able to share the dashboard data with their clients, colleagues, management, or any other group of people.
With the help of Power BI, users can now upload their Excel sheets to the cloud, making them easier to access by people with whom they want to share them. Power BI gives users the flexibility to choose a limited number of co-workers with whom to share the data.
Apart from that, the chosen people can also apply their modifications to the shared Excel workbooks and add their highlights or comments. Thus, Power BI is a simple way to share and analyze data without going through multiple platforms.
Microsoft Cloud helps you consolidate all the data in one place and access it later.
There are many useful features in Power BI, sharing presentations with colleagues, buddies, or whatever you may call them, Power BI users. Excel sheets can even be updated by users using the data on-site or in the cloud as well.
It also allows sharing from several devices that are supported, such as PCs, laptops, and mobiles. Power BI: There is a Power BI app for mobiles, via which users can access Power BI from their mobile. Also, users can query their data using natural language processing.
4) Give an idea about Power BI Desktop.
Power BI Desktop is software made for computers. Users can install the software directly on their PCs and laptops. There are many functions that users can do with the help of Power BI software, like data exploration, modeling, etc.
You can even create reports and publish them on the cloud system. That data can be accessed by anyone with the same software. There is also the option of saving the work on-site and sharing it with others.
5) Which sources of data can you connect Power BI with?
There are mainly three types of data sources that you can connect with Power BI. These are as follows:
Files: Data formats in the form of Excel, Power BI files, and CSV
Content Packs: A content pack consists of files and data that are placed as part of the same group. There are several service providers, like Google Analytics and Marketo, that will help users share and organize their work.
Connectors: These are pieces of software that connect with databases like Azure. With the help of connectors, users will be able to seamlessly transfer their data to different platforms.
6) What are the various forms of building blocks in Power BI?
There are five types of building blocks that form the main component of Power BI.
- Visualization: The representation of values and data in the form of pie charts, graphs, bars, maps, etc. is known as visualization.
- Datasets: The collection of data that users can use to create various visualizations is known as a dataset. The major examples of datasets are Excel sheets, Oracle tables, and SQL Server tables.
- Reports: Data that can appear on one or more pages is known as a report. There can be several types of reports, such as sales reports, logistics reports, performance reports, etc.
- Dashboard: A dashboard is like a single layer of visualization or multiple layers of visualization. Users have the option of integrating various types of visualizations into one format. An example of a dashboard includes pie charts, geographical maps, and bar charts.
- Tiles: Every report has one or more slides that display some specific data in a specific dashboard that is a part of another report. Such slides are known as tiles.
7) Name the types of filters in Power BI reports.
There are various levels of filters in a Power BI report:
- Visual-level filters: The visual filters are used to reduce the amount of data that can be seen in the report. The visual filters can work for both data and calculations.
- Page-level filters: These filters are applied to all the visuals on a specific page within a report. They allow you to filter data for a single report page without affecting other pages.
- Report-level filters: These report-level filters function for the whole report to filter its content and include only the relevant data in the final report.
Ready for a data-driven career leap? Learn about the trending Power BI career paths and take your career to the next level.
Read: Power BI Career Opportunities
Power BI Interview Questions and Answers – Set 2
8) What are the various components of the distinction in report publishing capacities between utilizing a live or direct question association, for example, to an Analysis Services model, compared with working with an information model nearby to the Power BI Desktop record?
With an information model nearby the PBIX document or Power Pivot exercise manual, the creator has full authority over the inquiries, the demonstrations or connections, the metadata, and the measurements.
With a live association with an Analysis Services information base, the client can't make new measurements, import new information, or change the categorization of the measurements.
9) What are the alternatives for three edit interactions on a visual tile in Power BI Desktop?
The three alternative communication alternatives are filter, highlight, and none.
Channel: It channels a visual dependent on the channel choice of another visual or tile.
Feature: It features just the connected components on the screen, dimming out the non-related things, and providing emphasis on the selected data.
None: It overlooks the channel choice of another visual, meaning the visual remains unaffected by the changes in other tiles.
10) What are the contrasts or differences between Power BI, Report, and Dashboard?
Dataset:
The source used to make reports and visuals is an information model (nearby to PBIX or XLSX) or a model in an Analysis Services Server. Information could be within the model (imported) or in a direct query association with a source.
Report:
An individual Power BI Desktop document (PBIX) containing at least one report page. I worked for a profound, intelligent examination experience for given dataset channels and arrangements.
Each report is associated with at least one dataset. Each page contains at least one visual, or tile.
Dashboard:
It is an assortment of visuals or infographics from published datasets. A dashboard displays all essential visuals and measurements from different datasets in one place.
11) How is information security executed in Power BI?
Power BI can apply row-level security to models. A DAX articulation is applied to a table, sifting its columns at question time. Dynamic security includes the utilization of USERNAME capacities in security job definitions.
Normally, a table is made in the model that relates clients to explicit measurements and a job.
12) What are many-to-numerous connections, and how might they be tended to in Power BI?
Many-to-many connections include a scaffold or intersection table mirroring the blend of two measurements (for example, specialists and patients).
Either all potential blends or those mixes that have happened Bi-directional cross-filtering connections can be utilized in PBIX. CrossField capacity can be utilized in Power Pivot for Excel. DAX can be utilized per metric to check and, alternatively, adjust the channel setting.
13) What is the Power BI Publisher for Excel?
The Power BI publisher for Excel works smoothly with Microsoft Excel to help users prepare graphs, charts, and other datasets.
After creating such datasets, users will be able to share their Excel workbooks and files on the cloud.
After sharing in the cloud, only people with the required permissions can access the stores' files. It uses software like Microsoft Azure to sync information to various devices and make them accessible to different people.
Unlock Excel’s full potential with our comprehensive guide to advanced features and functions.
Read: Advanced Excel Guide - Useful Formulas, Techniques and Functions
14) What is Power BI Q&A?
Power BI Q&A is a characteristic language apparatus that helps you question your information and get the outcomes you need from it. You do this by composing an answer into an exchange box on your dashboard, which the motor momentarily produces, like Power View.
Questions and answers decipher your inquiries and show you a rehashed inquiry of what it is looking for from your information. Questions and answers were created by Server and Tools, Microsoft Research, and the Bing groups to give you the feeling that they are genuinely investigating your information.
15) What is the designer software for Power BI?
It is an independent application where we can make Power BI reports and then transfer them to Powerbi.com, and it doesn't need Excel. It is a mix of Power Query, Power Pivot, and Power View.
16) Can you retrieve your Power BI information after uploading it to the cloud services?
Yes, we can invigorate our reports through the Data Management gateway and the Power BI Personal gateway. These gateways allow you to automatically refresh the datasets and reports in Power BI by connecting to your data sources, ensuring that the information remains up-to-date.
Power BI Interview Questions and Answers – Set 3
17) What are the various sorts of reviving information for our distributed reports?
There are four primary kinds of reviving in Power BI. Bundle invigorate, model or information revive, tile revive, and visual compartment revive.
Bundle invigorate:
This synchronizes your Power BI Desktop, or Excel, document between the Power BI administration and OneDrive, or SharePoint Online. Notwithstanding, this doesn't pull information from the first information source. The dataset in Power BI may be refreshed with what is in the document inside OneDrive or SharePoint Online.
Model/information invigorates:
It refers to invigorating the dataset inside the Power BI administration with information from the first information source. This is finished by either utilizing planned revitalization or invigorating it now. This requires an entryway for on-premises information sources.
Visual revive:
Visual Invigorate refreshes the reserve for tile visuals on the dashboard when information changes. This occurs like clockwork. You can likewise drive a tile to refresh by choosing the ellipsis in the upper right of a dashboard and choosing Refresh dashboard tiles.
Visual compartments revive
Invigorating the visual holder refreshes the reserved report visuals inside a report when the information changes. To find out about information revitalization and see how to actualize it, check out the accompanying connection.
18) Can users access Power BI on the premises themselves?
No, Power BI isn't accessible as a private, internal cloud administration. In any case, with Power BI and Power BI Desktop, you can safely associate your on-premises information sources.
With the On-premises Data Gateway, you can associate live with your on-premises SQL Server Analysis Services and other information sources.
You can likewise plan to revive with a unified door. If a passage isn't accessible, you can invigorate information from on-premises information sources using the Power BI Gateway Personal.
19) What are the information hotspots for the Power Map?
The information can either be available in Excel or remotely. To set up your information, ensure the entirety of the information is in the Excel table arrangement, where each column speaks to a special record.
Your section headings or line headings ought to contain text rather than real information so that Power Map will decipher them effectively when it plots the geographic directions.
Utilizing important marks likewise makes value and class fields accessible to you when you plan your visit in the Power Map Tour Editor sheet.
To utilize a table structure that all the more precisely speaks to time and geology inside Power Map, remember the entirety of the information for the table lines and utilize illustrative content names in the section headings.
20) Which language is utilized in Power Query?
Another programming language utilized in power inquiries is called M-Code. It is anything but difficult to utilize, and I like different dialects. M-code is a touchy language.
21) For what reason do we need Power Query in place of Power Pivot?
Power Query is a self-administration ETL instrument that stands for Extract, Transform, and Load and runs as an Excel file. It permits clients to pull information from different sources, control said information into a structure that suits their requirements, and load it into Excel.
It is generally ideal to utilize Power Query over Power Pivot, as it lets you load the information as well as control it according to the clients' needs while stacking.
22) What is the Power Map?
Power Map is an Excel feature that gives you a powerful arrangement of instruments to assist you with picturing and increasing your understanding of huge arrangements of information that have a geo-coded part.
It can assist you with creating 3D representations by plotting up to 10,000,000 information focuses, such as section, warmth, and air pocket maps, on the head of a Bing map.
If the information is time-stepped, it can likewise create intelligent perspectives that show how the information changes over time.
23) What is an inquiry collapsing in Power Query?
Query collapsing is when steps characterized in Power Query or Query Editor are converted into SQL and executed by the source information base instead of the customer machine.
It's significant for preparing execution and versatility, given the restricted assets on the customer machine.
Power BI Interview Questions and Answers – Set 4
24) Can SQL, Power Query, and the Query Editor be used together?
Yes, a SQL proclamation can be characterized as the wellspring of a Power Query and M work for extra preparation and rationale.
This would be a decent practice to guarantee that a proficient information-base inquiry is passed to the source and evade superfluous preparation and unpredictability by the customer machine and M work.
25) Would we be able to have more than one dynamic connection between two tables in the information model of power rotation?
No, we can't have more than one dynamic connection between two tables. Notwithstanding, there can be more than one connection between two tables; however, there will be just one dynamic relationship and numerous dormant relationships.
The dabbed lines are idle, and the consistent lines are dynamic.
26) What is a power pivot?
Power Pivot is an included feature for Microsoft Excel 2010 that empowers you to import a great many columns of information from various information sources into a single Excel exercise manual.
It lets you make connections between heterogeneous information, determine segments and measures utilizing recipes, and assemble PivotTables and PivotCharts.
You would then be able to additionally dissect the information so you can settle on opportune business choices without requiring IT help.
27) What is the Power Pivot Data Model?
It is a model that is comprised of information types, tables, segments, and table relations. These information tables are normally developed for holding information about a business substance.
28) How can you use the different content packs in Power BI?
Different content packs are prefabricated answers for well-known administrations as a feature of the Power BI experience. An endorser of an upheld administration can rapidly interface with their record from Power BI to see their information through live dashboards and intelligent reports that have been pre-worked for them.
Microsoft has delivered content packs for famous administrations, for example, Marketo, Adobe Analytics, Azure Mobile Engagement, CircuitID, comScore Digital Analytix, Quickbooks Online, and TyGraph.
These organizations take help from Microsoft software and tweak it with their own modifications to get the most out of technology. Apart from that, there are other packs, like the authoritative substance packs.
These authoritative substance packs are highly beneficial for clients and organizations. Authoritative substance packs give clients, BI experts, and framework integrators the instruments to assemble their substance packs with common software developed inside their association.
Power BI Interview Questions and Answers For Experienced – Set 5
29) Mention important components of SSAS.
Given below are some of the important components of SSAS:
OLAP Engine
An OLAP engine is used to allow fast ad-hoc queries at a fast pace for end users.
Data Drilling
It refers to the process of going down a level of hierarchy to explore the details of the data.
Slicers
Data slicing refers to the process of placing data in rows and columns.
Pivoting
Pivoting refers to the process of switching categories of data between rows and columns.
30) What are the different stages in the workings of Power BI?
Given below are the three different stages of working on Power BI:
- Data Integration
- Data processing
- Data Presentation
31) Name the variety of Power BI formats.
Power BI is mainly available in three formats, as listed below:
- Power BI Desktop: An Open-Source Version for Desktop Users
- Power BI Services: For Online Services
- Power BI Mobile Application: Compatible with Mobile Devices
Advanced Power BI Interview Questions And Answers – Set 6
32) What is the xVelocity in-memory investigation motor utilized in the Power Pivot?
The fundamental motor behind the power turn is the xVelocity in-memory examination motor. It can deal with a huge amount of information since it stores it in columnar information bases and uses in-memory investigation, which brings about quicker handling of information as it stacks all information in RAM.
33) What are the most common data-shaping techniques?
The most common data-shaping techniques involve:
- Removing Columns and Rows
- Adding an Index
- Applying for a Sort Order
- To create custom columns
- Pivoting Columns
- Grouping Rows
34) What is z-order in Power BI?
Z-order refers to the design choice used for presenting visuals over shapes. It is a method to apply to reports with multiple elements as well as to refresh the display after a report has multiple elements.
35) What are KPIs in Power BI?
KPI is abbreviated as Key Performance Indicator. Professionals in organizations can operate under the KPI regulations. KPIs are put in place by organizations for everyone. These KPIs function as their benchmarks. The KPIs compare themselves with past performances and evaluate the improvement.
Technical Based Power BI Interview Question and Answers – Set 7
36) What is the role of DAX in Power BI, and how do you optimize complex DAX queries for performance?
DAX (Data Analysis Expressions) is used for data modeling and calculations. Optimizing complex DAX queries involves reducing the use of row context, using calculated columns sparingly, leveraging variables, and minimizing FILTER operations for better performance.
37) Can you explain the difference between calculated columns and measures in Power BI, and when to use each?
Calculated columns are used for static data and are computed when the data model is loaded. Measures, on the other hand, are calculated dynamically based on user interactions with the report. Measures should be used when calculations need to be dynamic based on filtering or slicing.
38) What are some common performance optimization techniques in Power BI?
Common techniques include using star schema data models, reducing cardinality, filtering data before importing, avoiding calculated columns in large tables, utilizing aggregations, managing relationships efficiently, and reducing the complexity of visuals.
39) How do you handle security in Power BI with Row-Level Security (RLS)?
Row-Level Security (RLS) allows you to restrict data access for users at the row level. This is implemented by creating security roles and using DAX filters to define the data that each role can access. Dynamic RLS can also be implemented using the USERNAME() or USERPRINCIPALNAME() functions.
40) What is the role of Power Query in the data transformation process, and how would you handle incremental data refresh in Power BI?
Power Query is used for ETL (Extract, Transform, Load) processes within Power BI. It helps in cleaning, transforming, and loading data. Incremental data refresh can be managed by configuring parameters in Power BI Desktop and setting up partitioned data loads in the Power BI service to avoid reloading the entire dataset during refresh.
Tips to Ace the Power BI Interview
Power BI in learning data analytics is beneficial, and its features involve unlimited access to on-premise and in-cloud data, stunning visualizations shareable with wide audiences, a robust collection of learning materials, and solutions to complex questions. As previously discussed, the above list of Power BI-technical interview questions and answers for experienced or fresher will improve the power bi interview preparation even better.
Here are some essential tips to ace the Power BI interview:
-Master the Fundamentals
-Stay Updated with New Features
-Practice Hands-On Scenarios
-Understand Business Applications
-Prepare for Performance Optimization Questions
-Familiarize Yourself with DAX and Power Query
As previously discussed, the above list of Power BI interview questions and answers for experienced or freshmen will enhance the interview process even better. Power BI is utilized for managing all the facets of a company. Professionals can easily crack related interviews remarkably with the latest Power BI interview questions and answers for experienced candidates, as mentioned above.
If you seek to acquire skills and learn about business analytics, register with Sprintzeal and explore the Business Analytics Certification Course.
If you have queries for "Power BI Interview Questions and Answers 2026" or the certification course, do reach out to us in the comment section provided below.
Recommended Read:
Data Visualization – Benefits and Tools
Data Science Interview Questions and Answers
If you are aspiring to make a career in data handling, getting the Big Data Certification and Microsoft Power BI Certification Training is a great option to gain knowledge and skills in the field. It is an industry-recognized certification with huge demand in the market. Another popular one is the Big Data, Hadoop, and Spark developer certification.
To explore more career-making courses, you can visit Sprintzeal's All Courses, and for any course-related queries, you can chat with the course experts and find the training/certification that will benefit your career.
Categories
- Project Management 176
- Others 139
- IT Security 121
- AI and Machine Learning 111
- Digital Marketing 105
- Business Management 103
Recent posts
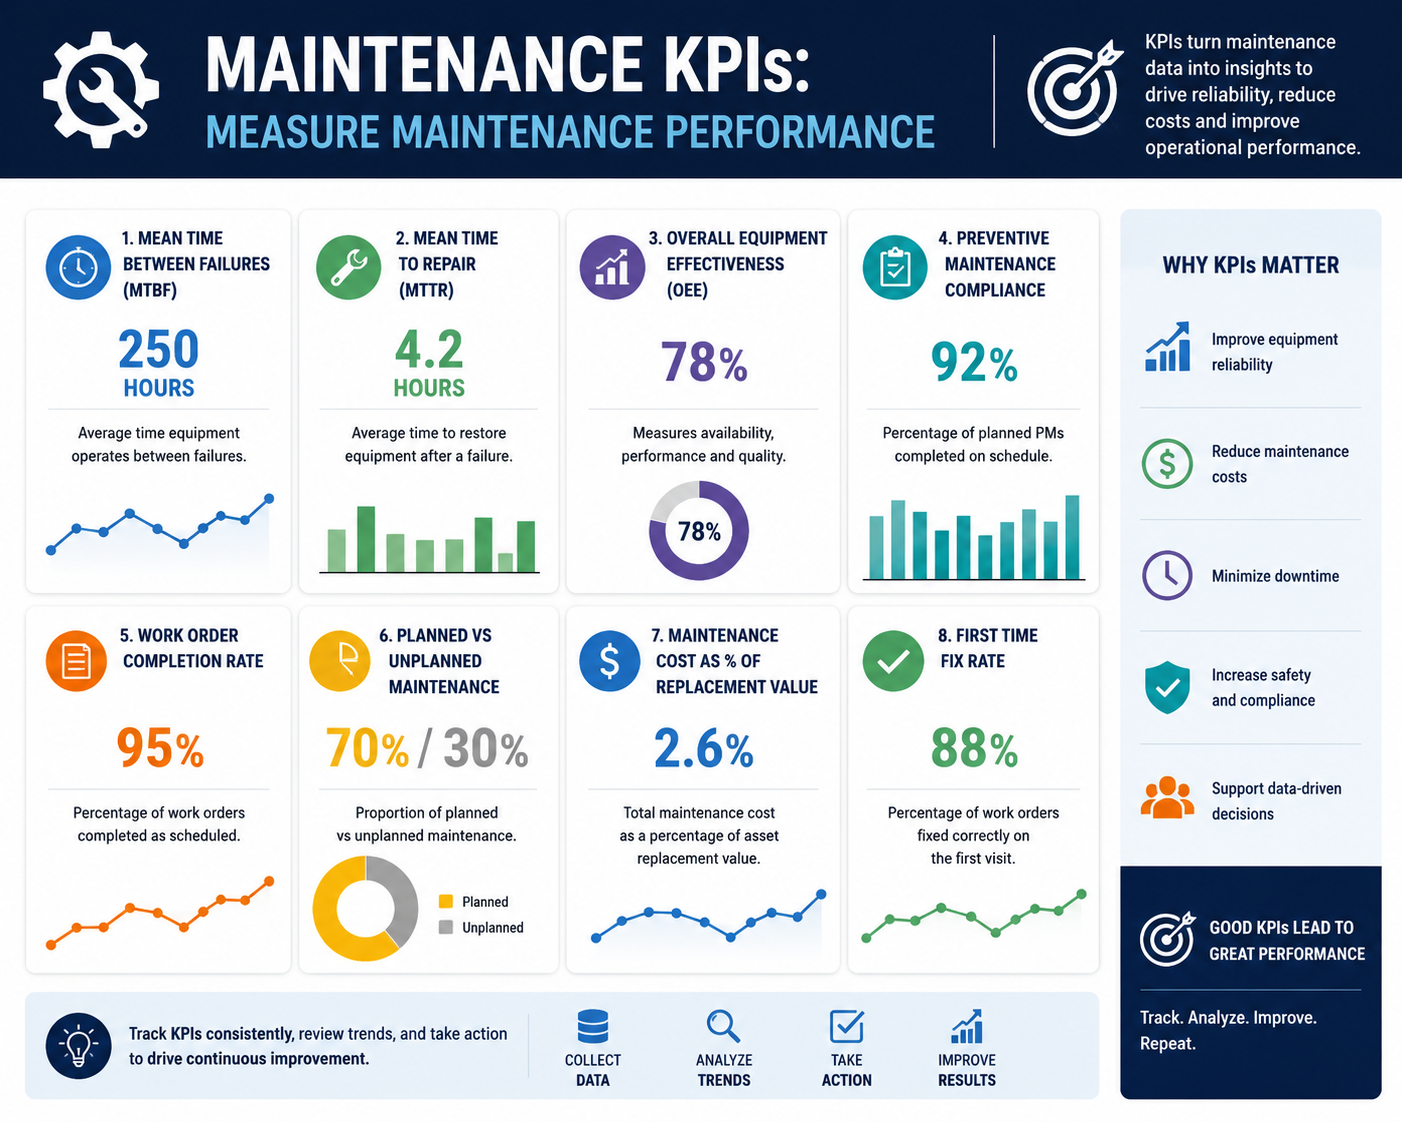
What Maintenance KPIs Do Managers Use for Smarter Resource Allocation?
Tue, 07 July 2026