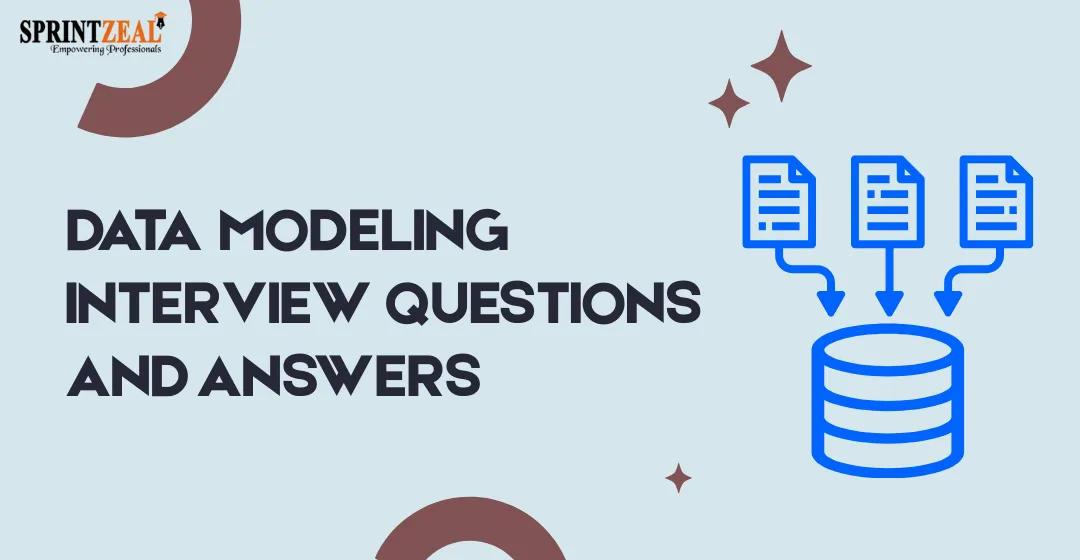
Data Modeling Interview Questions and Answers 2026
-
 By Arya Karn
- Published on Dec 8 2025
In today’s market, companies are hungry for skilled data modelers—there are over 122,000 openings just in the US and salaries often start above $90,000. The big data analytics market is set to hit $549 billion by 2028, making advanced data management more important than ever. If you want to stand out and land top roles, practicing “data modeling interview questions” will help you confidently structure information for AI, cloud, or business analytics. Preparing for these interview questions shows recruiters you understand the essentials of organizing and connecting business data. So, mastering “data modeling interview questions” is a top move for anyone who wants to build a bright, future-proof tech career.
Table of Contents
Data Modeling Interview Questions and Answers For Freshers
1. What is a data model? What are the different types?
A data model is used to organize and describe the structure and the relationships of the data within the system. So basically, there are three types of data models: logical (which adds details and attributes and is independent of technology), physical (which reflects database-specific structures like tables and indexes), and conceptual (which is high-level and concentrates on entities and relationships). Each has a specific function in database design.
2. Explain the differences between logical and physical data models
Tip : Mastering data modeling interview questions is your first step towards landing top data roles
3. What are normalization and denormalization? When and why would you use them?
Let's understand it this way: Normalization is a technique that organizes data to minimize duplication, or you can say data redundancy. It helps to improve data integrity through the division of data into multiple related tables. This process guarantees that the data remains consistent and free of anomalies, making it suitable for environments. Let's try to understand this with an example of normalization: storing customer data once and having orders reference that one instance of the customer to eliminate duplicates.
On the other hand, denormalization is the process of combining tables, and generally, it combines tables to enhance query performance. When using denormalization, we would like to keep related data together to maintain faster read operations, thus avoiding complex joins in the modified table. analytics), lization is often used for read-heavy systems (such as reporting systems or analytics), and it often introduces inconsistencies (such as when customer detail may show up on every order record to speed raising a query).
Use normalization when data accuracy and efficiency of updates are most important. Use denormalization when timeliness of read access and query performance is more important than storage space and redundancy of data. Balancing normalization and denormalization depends on the type of workload the application has and is performance driven.
Tip: When facing data modeling interview questions , think of structuring data as storytelling
4. What are the different normal forms (1NF, 2NF, 3NF, BCNF etc.) and why are they important?
Normalization is the process of organizing a database so that data is cleanly separated and manageable, while also minimizing or preventing duplicate data. It is done in steps known as normal forms:
- 1NF (First Normal Form): Each single piece of data is in its own cell—meaning, no list of items or groups of items in a single cell.
- 2NF (Second Normal Form): All data depends on the complete main key. If you are identifying a record on two things, the remaining data must depend on both parts of the main key, not just one component of it.
- 3NF (Third Normal Form): All data must not depend on anything else.
This means data must be related only to the main key, as defined previously.
- BCNF (Boyce-Codd Normal Form): The stricter, more conservative version of 3NF that helps avoid more complicated related entering of duplicates.
There is a beyond this and a much broader level of advanced normal forms, but at its essence, these are the concepts.
Why? Because it prevents a repeated or an erroneous data entry of records. When data is referenced more than once in a database, you will want to have referenced data cleanly separated so if one reference to the data needs to be modified, the adjustment must only happen once, and there is little chance of doing it incorrectly or failing to remember that you have made the change.
Reliable, manageable records over time.
5. What is a surrogate key? How is it different from a natural key?
- A surrogate key is a unique ID created by the database that has no real data meanings. For instance, a customer may be assigned customer_id 101, 102, etc. to make it easier to identify records.
- A natural key is a key that is made from real data that already exists, and the key uniquely identifies a record, such as a social security number or an email address.
Difference:
- Surrogate keys are system-generated, simple, and stable.
- Natural keys come from real data and carry business meaning.
Why use surrogate keys?
- When natural keys are complex, changeable, or not unique.
- They improve database performance and simplify relationships.
Tip : Preparation is key: never underestimate the power of common data modeling interview questions
6. Describe the primary key vs. the foreign key vs. the composite key
7. What are entities, attributes, and relationships? What is an ER (Entity-Relationship) diagram?
- Entities: Entities are things or objects to store information about. These can be people, places, or things. In an ERD, entities appear as rectangles. “Course” and “Student” are examples of entities.
- Attributes: Attributes further describe the attributes or properties of an entity. Attributes appear as ovals, connected to their entity. A Student entity may have attributes such as StudentID, Name, and Age.
- Relationships: Relationships are what connect or relate two entities within an ERD. Relationships are represented by diamonds, which are between two entities and represent how they are connected. For example, “enrolls in”: a Student has a relationship with a Course. The connecting lines represent connection between the entities and the relationship.
Tip : Data modeling interview questions interview train you to think like a data architect
An Entity Relationship Diagram (ERD) is a well-designed visual representation that explains how data is organized within a database, as well as the links between various types of data.
Components:
- Entity: Something real or useful. For example, “Student” or “Course.” It is represented by rectangles.
- Attributes: Information about an entity, such as the name of the Student or the ID number. Attributes are represented by ovals.
- Relationship: How entities are connected to one another. For example, “enrolls” is between Student and Course. Relationships are represented by diamonds.
8. What are star schema and snowflake schema?
- Star Schema: Has one central fact table (main data like sales) connected directly to simple dimension tables (details like product or date). The dimension tables are denormalized, meaning data is stored together, making queries fast and easy to understand. It looks like a star shape.
- Use it when fast query performance and simplicity matter, especially with small to medium datasets.
- Snowflake Schema: More complex with normalized dimension tables split into sub-tables to reduce data duplication. It looks like a snowflake with branches. This saves storage and maintains data integrity but requires more joins, which can slow queries.
- Use it when storage efficiency, data accuracy, and handling complex data hierarchies are important, often with large datasets.
Tip : Real job interviews often include data modeling interview questions to see your problem-solving skills
9. What is a fact table vs. a dimension table? Give examples.
10. What are Slowly Changing Dimensions (SCD)?
Slowly Changing Dimensions (SCD) are a way to handle data in data warehouses that changes slowly over time, such as a customer’s address or employee’s job title. Since these changes don’t happen often but still matter, SCD techniques keep track of history for analysis.
Types of SCD:
- Type 1: Overwrites old data with new data; no history is kept. Use when old values aren’t important, like when correcting a typo.
- Type 2: Keeps a full history by adding a new record when data changes. This lets you see past and current values. Example: tracking employee position changes.
- Type 3: Stores limited history by adding new columns, like having ‘old address’ and ‘current address’ fields. Good for tracking small changes.
- Type 4: No changes allowed; the attribute stays fixed.
- Type 5: Uses separate history tables to track changes.
- Type 6: Combines Types 1, 2, and 3 for flexible tracking.
Tip : Practicing data modeling interview questions can make tough interviews feel easier
Data Modeling Interview Questions and Answers For Experienced
11. What is data granularity? Why is it relevant to modeling?
"Data granularity" refers to the level of detail of your data—that is, the smallest piece of data available. Think of your data as a pizza. When you look at the pizza as a whole, you are looking at low granularity data—you’re looking at one large piece of data. However, if you look at each slice, that is a greater level of detail relevant to granularity. Or if we look at each slice and look at each topping, that is a level of granularity even finer.
Why does granularity matter in modeling?
- High granularity" refers to very granular data—this is data that includes detailed information about every customer purchase with time, product, and price (items, themes, purpose, objectives, rationales, etc.). High granularity allows your organization to analyze specific patterns, but it requires considerable storage space and computation.
- Low-granularity data is summarized data, meaning after a time period it cannot be broken down any more than total sales per month. While low granularity is easier to work with, the quantifications may be less informative.
Choosing the right granularity for data means weighing the tradeoffs between detail and production. That is, having a highly granular data price point helps the analyst to go in-depth with multi-faceted analysis. Summarized data, however, helps get quick eyes on big trends or data points in no time. For example, selling by every purchase transaction might be considered high granular data; however, the organization will report monthly totals to executive leadership based off of low granular data.
12. What is data sparsity? How does it impact aggregation/performance?
Data sparsity occurs when you have a dataset with a large number of empty or zero values. Data sparsity happens when there are large numbers of zero or missing data points in your dataset, not because the zero or missing value is unknown, but because there is no data there.
For example, when you have a huge list of customers and products for sale, if you evaluate the customers to see what they buy, many customers will have only a few products they purchased—therefore, the purchase table will not data modeling interview questions contain a full set of useable data, meaning this is sparse.
Implications of Sparsity in Aggregation and Performance:
- Aggregation: When aggregating data to get totals and averages, sparse datasets typically mean there are a large number of zero or missing values, which may affect or slow down the calculation of the totals and averages because the calculations have to scan or conduct some operation in the underlying large table with a lot of "nothing" in it.
- Performance. In general, accessing or retrieving data from databases or analysis tools may be slower when sparse because data storage and data access are designed for maximizing the speed of retrieves, while managing a large empty space of empty data cells tends to affect speed and efficiency.
Tip : Understanding common data modeling interview questions helps you connect ideas in data easily
13. What are subtype/supertype entities?
Supertype: A general, broad entity that holds common information shared by multiple related entities. Think of it as the parent category.
Example: "Customer" is a supertype with basic info like CustomerID, Name, and Address.
- Subtype: A more specific category under the supertype that inherits the common info but also has additional details unique to it. Think of it as a child category.
Example: Under Customer, you could have subtypes like "Individual Customer" (with social security number) and "Organization Customer" (with company registration number).
Why use this:
- To avoid repeating common data across multiple entities.
- To keep models clean, organized, and flexible for future changes.
- To represent real-world categories and their specific traits clearly.
Another example:
- Supertype: Vehicle (with attributes like Make, Model, Year)
- Subtypes: Car, Truck, Motorcycle (each with unique attributes like Car has number of doors, Truck has payload capacity)
Tip : Be ready to discuss ER diagrams in data modeling interview questions
14. What is enterprise data model vs data mart vs data warehouse?
Enterprise Data Model
The enterprise data model is considered a large blueprint, or map, for all data in a company. It organizes and defines all data entities, relationships, rules, and standards that exist across the entire organization and provides a consistent structure and understanding of data across the company. Therefore, it would include all the ways that customer, product, sales, and employee data relate across all systems in the company.
Data Warehouse
A data warehouse is a large, centralized storage mechanism that collects, cleans, and stores data from many different sources (departments or systems). Data warehouses consist of historical, integrated data for reporting, analysis, or business intelligence. Data in the data warehouse follows the structure and standards defined by the enterprise data model to ensure that there is consistency related to the data. For example, all of the company's sales data, customer data, and inventory data are kept in one place (the data warehouse) that tracked all of this data over many years.
From an implementation perspective, one thing candidates often mix up is assuming JSON can be treated like a clean relational table immediately. In Snowflake, the practical steps are usually - store JSON safely, extract what you need, and only then model it. Sonra’s Snowflake JSON loading guide shows that workflow clearly.
Data Mart
A data mart is a small subset of the data warehouse that is focused (usually) on a specific business area or department within the enterprise. The data mart contains only the data relevant for that business area or department to further simplify data access for those users. For example, a sales data mart would only have sales-related data that would be useful for the marketing team.
Tip: Review how entities and relationships are represented in typical data modeling interview questions
14. What is OLTP vs OLAP?
- What is OLTP? (Online Transaction Processing)
- OLTP systems are used to process business transactions on a daily basis in real-time.
- Examples: Purchase of something online, and booking tickets, and withdrawal from an ATM.
- Optimized for fast processing of many small, quick transactions (insert, update, delete).
- Will use normalized data models based on a database design that optimizes for performance by removing redundancy and ensuring data integrity.
- Key focus: Speed and accuracy for many users at the same time.
- What is OLAP? (Online Analytical Processing)
- OLAP systems are used to analyze large amounts of historical data for reporting, trending, and decision-making.
- Examples: Reports on sales trending over multiple years, analysis of customer behavior.
- Optimized for complex queries that scan and aggregate large datasets.
- Will use denormalized models (like the star schema) for faster reading and easier analysis in a multi-dimensional data structure.
- Key focus: Fast retrieval of data, complex analysis, and not allowing real-time updates.
Tip: Practice explaining denormalization, as it often comes up in data modeling interview questions
Conclusion
As you prepare for data modeling interview questions, consider also learning comprehensively through learning or training programs. For example, one course you may want to learn about is the Data Science Master Program that is offered by Sprintzeal.
While preparing for data modeling interview questions is valuable education, looking to formal learning programs like this can provide you a better understanding of the overarching data science and data modeling concepts while learning through some theory and practical projects. Just looking at interview questions can give you better confidence for the interview process, but educational programs like this can provide you with a better understanding of the core principles that key data modeling questions are based upon.
Even throughout the course summarized throughout each topic are end-to-end data workflows; you can start to tie concepts together when you encounter data modeling interview questions and see how this maps into real-world components and general data engineering practice.
As you prepare, it can become more than memorizing preparation answers to understand modelling as a professional competence. Your preparation can include the combination of formal learning with the specific practice of targeted data modeling interview questions, so you are positioning yourself to be a unique candidate and get established in your data career.
FAQ (Frequently Asked Questions)
1. What are the four types of data models?
- There are four principal types of data models:
- Hierarchical (data is organized like a tree) ,
- Network (nodes are linked in a graph),
- Relational (tables organized in rows and columns, linked together based on keys),
- Entity-relationship (entities and relationships represented using diagrams).
2. Is SQL a data modeling tool?
No. SQL is a language you use to manage and query the database. It is not a data modeling tool. Data modeling tools help design the structures of data visually or conceptually. SQL is how you implement the designs.
3. What are the three kinds of data models?
- Conceptual (a broad, business perspective),
- Logical (a more detailed look at the underlying structure without the details of the technology),
- Physical (a description of how data is actually represented in the databases).
4. What is data modeling in ETL?
Data modeling in ETL describes how data moves and transforms from the source systems to a clean state in a structured format in the target database.
5. What are the three phases of data modeling?
The three phases are conceptual, logical, and physical modeling. The modeling phases progress from broad ideas to detailed implementation of the data into the database.
6. Which tool is used for data modeling?
Some tools are ERwin, Microsoft Visio, IBM InfoSphere Data Architect, and MySQL Workbench (a free open-source tool).
This structure will help you think conceptually through the key ideas clearly and build a strong foundation of knowledge around data modeling.
Popular Programs
Certified Machine Learning Expert (CMLE) DS2040
Live Virtual Training
- 4.9 (51 + Ratings)
- 46k + Learners
Certified Data Science Developer (CDSD) DS2020
Live Virtual Training
- 4.4 (650 + Ratings)
- 34k + Learners
Certified Data Scientist Finance (CDSFIN) DS2130
Live Virtual Training
- 4.6 (650 + Ratings)
- 28k + Learners
Trending Posts
Apache Spark Interview Questions and Answers 2026
Last updated on Aug 30 2022
What is Big Data Analytics? - A Beginner's Guide
Last updated on Dec 28 2022
Data Visualization Strategy and its Importance
Last updated on Apr 10 2024
Data Analysis Tools and Trends for 2026
Last updated on Feb 12 2024
How to repair a crashed MySQL table?
Last updated on Aug 13 2025
Hadoop Architecture Guide 101
Last updated on Apr 12 2023
Categories
- Other 75
- Agile Management 49
- Cloud Computing 58
- Project Management 175
- Data Science 69
- Business Management 88
- Digital Marketing 87
- IT Service Management 36
- Programming Language 61
- AI and Machine Learning 91
- IT Security 113
- Quality Management 78
- IT Hardware and Networking 27
- Microsoft Program 5
- Workplace Skill Building 15
- Risk Management 9
- Information Security 8
- Leadership and Management 9
- Corporate Training and Development 1
Trending Now
Big Data Uses Explained with Examples
ArticleData Visualization - Top Benefits and Tools
ArticleWhat is Big Data – Types, Trends and Future Explained
ArticleData Science vs Data Analytics vs Big Data
ArticleBig Data Guide – Explaining all Aspects 2026 (Update)
ArticleData Science Guide 2026
ArticleData Science Interview Questions and Answers 2026 (UPDATED)
ArticlePower BI Interview Questions and Answers (UPDATED)
ArticleData Analyst Interview Questions and Answers 2026
ArticleApache Spark Interview Questions and Answers 2026
ArticleTop Hadoop Interview Questions and Answers 2026 (UPDATED)
ArticleTop DevOps Interview Questions and Answers 2026
ArticleTop Selenium Interview Questions and Answers 2026
ArticleWhy Choose Data Science for Career
ArticleDevOps Engineer Interview Questions - Best of 2026
ArticleSAS Interview Questions and Answers in 2026
ArticleDevOps Engineer - Career path, Job scope, and Certifications
ArticleHow to Become a Data Scientist - 2026 Guide
ArticleHow to Become a Data Analyst
ArticleBig Data Project Ideas Guide 2026
ArticleWhat Is Data Encryption - Types, Algorithms, Techniques & Methods
ArticleHow to Find the Length of List in Python?
ArticleHadoop Framework Guide
ArticleWhat is Hadoop – Understanding the Framework, Modules, Ecosystem, and Uses
ArticleBig Data Certifications in 2026
ArticleHadoop Architecture Guide 101
ArticleData Collection Methods Explained
ArticleData Collection Tools - Top List of Cutting-Edge Tools for Data Excellence
ArticleWhat is DevSecOps and its Importance
ArticleTop 10 Big Data Analytics Tools 2026
ArticleKafka vs Spark - Comparison Guide
ArticleDevOps Career Guide 2026
ArticleData Processing - A Beginner's Guide
ArticleData Structures Interview Questions
ArticleData Analysis guide
ArticleData Integration Tools and their Types in 2026
ArticleWhat is Data Integration? - A Beginner's Guide
ArticleData Analysis Tools and Trends for 2026
ebookA Brief Guide to Python data structures
ArticleWhat Is Splunk? A Brief Guide To Understanding Splunk For Beginners
ArticleBig Data Engineer Salary and Job Trends in 2026
ArticleWhat is Big Data Analytics? - A Beginner's Guide
ArticleData Analyst vs Data Scientist - Key Differences
ArticleTop DBMS Interview Questions and Answers
ArticleTop Database Interview Questions and Answers
ArticlePower BI Career Opportunities in 2026 - Explore Trending Career Options
ArticleCareer Opportunities in Data Science: Explore Top Career Options in 2026
ArticleCareer Path for Data Analyst Explained
ArticleCareer Paths in Data Analytics: Guide to Advance in Your Career
ArticleA Comprehensive Guide to Thriving Career Paths for Data Scientists
ArticleWhat is Data Visualization? A Comprehensive Guide
ArticleData Visualization Strategy and its Importance
ArticleTop 10 Best Data Science Frameworks: For Organizations
ArticleData Science Frameworks: A Complete Guide
ArticleFundamentals of Data Visualization Explained
Article15 Best Python Frameworks for Data Science in 2026
ArticleTop 10 Data Visualization Tips for Clear Communication
ArticleHow to Create Data Visualizations in Excel: A Brief Guide
ebookHow to repair a crashed MySQL table?
ArticleTop PySpark Interview Questions and Answers for 2026
Article5 Popular Data Science Careers That Are in Demand
ArticleTop Data Warehouse Interview Questions to Crack in 2026
ArticleWhat Is a Data Scientist? Salary, Skills, and How to Become One
ArticleTop Companies Hiring for Data Science: Explore Data Scientist Jobs
ArticleWhat Is a Data Science Course? How to Get Into Data Science From Non-Tech Background
ArticleGeneralized Linear Models: Understanding GLMs and Their Applications
ArticleSQL vs NoSQL: Understanding the Key Differences and Use Cases
ArticlePower BI vs Tableau : Which BI tool is best for you?
Article