Inspirational journeys
Follow the stories of academics and their research expeditions
Generalized Linear Models: Understanding GLMs and Their Applications
Introduction
What are Generalized Linear Models (GLMs)
Generalized Linear Models represent a significant upgrade to standard linear regression. They are specifically designed to work with data from the real world which cannot be represented by a line with normally distributed residuals. From a technical point of view, GLMs are the go-to choice in the areas of statistics, machine learning, data science, healthcare analytics, finance, and social sciences because they combine flexibility with interpretability.
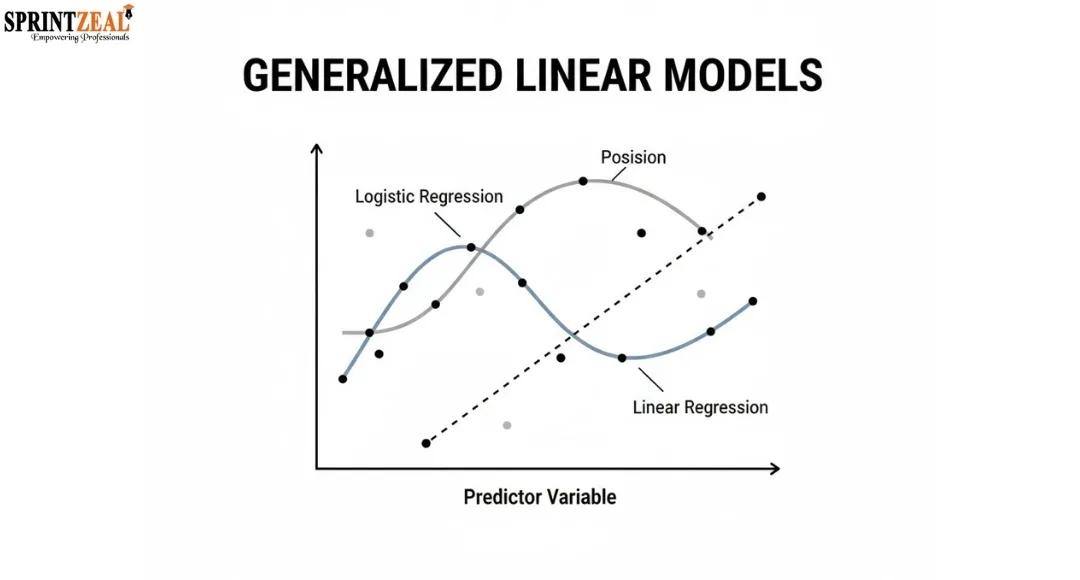
Basically, GLMs are a set of statistical methods that relate the input variables to the output variable whose distribution might be non-normal.In contrast to single linear regression, GLM can efficiently handle binary outcomes, counts, rates, and even skewed data.They act as a bridge between classical statistics and machine learning by not losing the mathematical rigor and at the same time being applicable to the real world.
Generalized Linear Models operate on the principle that that they should have the following three components:
Random Component: The variable that measures the response is to be drawn from a distribution of the exponential family (for instance, Binomial, Poisson, Gamma).
Systematic Component: Predictor variables are to be combined linearly.
Link Function: The function that links the linear predictor to the expected value of the response variable
Typical Examples of Generalized Linear Models
Logistic Regression: It comes handy in cases where the results are binary such as yes/no or true/false.
Poisson Regression: This model is conceptually the best match for count variables such as the number of times a website is visited or the number of events that occur over a certain period.
amma Regression: Used mainly in situations where the data is continuous and positively skewed, for example, insurance claims or waiting times.
Check out this types of regression blog to know more about the models.
Why Should Anyone Care About GLMs?
One of their most important features is the fact that they can work with data that is not normally distributed.Besides that, they are easy to understand and are based on sound statistical principles.Moreover, they can be used for very simple analyses and at the same time, they can be the base of complex predictive models.Is there a chance that you had data and you tried to apply linear regression, but it just didn’t work and you were thinking that a more flexible model like GLM would do a better job?
Why Use Generalized Linear Models
Linear regression has its limits in practice
Traditional linear regression is effective when the dependent variable is continuous, normally distributed, and has a linear relationship with the independent variables. But, in the case of real-world data, it is hardly ever so tidy. Binary outcomes, count data, skewed distributions, and non-constant variance are the issues that most of the time violate these assumptions and thus lead to unreliable predictions and incorrect interpretations.
GLMs keep the door open for linear regression without losing interpretability
Generalized Linear Models (GLMs) keep the advantages of linear models (simplicity, understandability) and at the same time provide the models with more flexibility due to different probability distributions and link functions. So, one can model non-normal data precisely without having to go for complex black-box algorithms right away.
Better coping with real data-types
GLMs are the right answer when the failure of linear regression means:
– Binary outcomes (yes/no, success/failure) through logistic regression
– Count data (number of events, visits, clicks) by means of Poisson or negative binomial models
– Skewed positive values (time, cost, insurance claims) via gamma regression
This makes GLMs far more aligned with how data behaves in production systems.
Statistical robustness and reliable inference
Unlike many machine learning models, GLMs provide statistically meaningful coefficients, confidence intervals, and hypothesis tests. This is critical in regulated industries like healthcare, finance, and insurance, where explainability matters as much as accuracy.
Strong fit for business and operational use cases
GLMs are widely used in:
– Healthcare: disease risk prediction and patient outcome modeling
– Finance: credit scoring, default probability estimation
– Marketing: conversion modeling, click-through rate prediction
– Operations: demand forecasting and incident modeling
Scales well and integrates easily
GLMs are computationally efficient, scalable to large datasets, and have good support in R, Python (statsmodels), and enterprise ML platforms.
In case your data is not "perfect" for linear regression assumptions and you still want to have clarity, control, and statistical rigor, why compromise with an oversimplified model when a GLM can depict the situation more accurately?
Core Components of GLMs
1. Distribution (Random Component)
GLM doesnt require the target variable to be normally distributed. It is actually assumed to be from the exponential family of distributions which comprises:
Normal
Binomial
Poisson
Gamma
Inverse Gaussian
This is the major advantage of generalized linear models that allow them to work well for: ( Binomial) Count data (number of events Poisson)Skewed continuous values (insurance claims, response time Gamma)By simply using the appropriate distribution GLMs depict the real data nature without forcing the data to fit a normal distribution.
Why it matters: Choosing the right distribution makes the model more understandable, less biased, and produces more reliable predictions.
2. Link Function (Systematic Component)
The link function connects the average value of the response variable with the linear predictor. It changes the output so that the predictions are still valid for the specified distribution.
Some of the frequently used link functions are:
Logit used in logistic regression for binary outcomesLog used in Poisson regression for count dataIdentity used when the relationship is already linearThe link function is the one that keeps model outputs within rational limits (e.g., probabilities between 0 and 1).
Why it matters: Many models would be impossible to run logically without this function because it controls the range of the outputs.
3. Linear Predictor (Deterministic Component)
The linear predictor looks familiar:
η = β₀ + β₁X₁ + β₂X₂ + … + βₙXₙ
It represents a weighted combination of input features, just like in linear regression.
What changes in GLMs is how this predictor relates to the outcome—via the link function instead of directly.
Why it matters:
This component keeps GLMs interpretable, allowing practitioners to understand feature influence while still modeling complex data behavior.
How These Components Work Together :
The distribution defines what kind of data you are modeling
The link function defines how predictions are transformed
The linear predictor defines how inputs influence the outcome
Together, they form a powerful, flexible modeling framework that balances statistical rigour with real-world practicality.
Types of Generalized Linear Models
1. Logistic Regression (Binary Outcomes)
Best for: Yes/No, True/False, Success/Failure type problems
Response distribution: Binomial
Link function: Logit
Typical usecases:
Spam detection (spam vs not spam)Disease diagnosis (positive vs negative)User churn predictionWhy it matters: Logistic regression is generally the first GLM that people learn as it directly provides classification solutions which are still statistically interpretable.
Poisson Regression (Count Data)
Good to have: Count, based outcomes where the values are non, negative integers
Response distribution: Poisson
Link function: Log
Typical use cases:
Number of website visits per day
Count of defects in manufacturing
Accident frequency analysis
Key assumption: Mean ≈ Variance
Why it matters: If you are mostly interested in how many times something takes place rather than whether it takes place at all, then it is ideal.
2. Negative Binomial Regression (Overdispersed Counts)
Suitable for: Count data with high variance (overdispersion)
Response distribution: Negative Binomial
Link function: Log
Typical use cases:
Insurance claim counts
Social media engagement metrics
Why it matters: When Poisson regression fails due to overdispersion, this model steps in as a more flexible alternative.
Gamma Regression (Positive Continuous Data)
Best for: Continuous values that are strictly positive and skewed
Response distribution: Gamma
Link function: Log or Inverse
Typical use cases:
Insurance claim amounts
Time-to-completion data
Medical cost modeling
Why it matters: Gamma regression handles skewed distributions much better than linear regression.
3. Gaussian (Normal) GLM
Best for: Continuous data with normal distribution
Response distribution: Gaussian
Link function: Identity
Typical use cases:
Traditional regression problems
Why it matters: This is essentially linear regression under the GLM framework, showing how GLMs generalize classical methods.
4. Inverse Gaussian Regression
Best for: Positively skewed time-based data
Typical use cases:
Survival analysis
Reaction time modeling
Why it matters: Useful when variance increases with the mean in a non-linear way.
Multinomial and Ordinal GLMs
Best for: Multiple categories or ordered outcomes
Typical use cases:
Customer satisfaction ratings
Product choice modeling
Why it matters: These models extend GLMs beyond binary decisions.
Model Estimation and Fitting
Model Estimation and Fitting in Generalized Linear Models (MLE & IRLS)
Purpose of model estimation in GLMs
Estimation defines how a generalized linear model learns from data.
Unlike linear regression, GLMs handle non-normal response distributions.
The estimation process must align with both:
The assumed probability distribution
The chosen link function
Well-fitted parameters ensure interpretability, statistical validity, and stable predictions.
Maximum Likelihood Estimation (MLE)
MLE is the core statistical principle used to estimate GLM parameters.
The objective is to find coefficient values that maximize the likelihood of observed data.
Key characteristics of MLE in GLMs:
Works with distributions from the exponential family
Optimizes the log-likelihood instead of squared errors
Produces statistically meaningful outputs such as:
Coefficient estimates
Standard errors
Confidence intervals
Hypothesis tests
MLE naturally adapts to different GLM types, including logistic and Poisson regression.
Why GLMs lack closed-form solutions
The presence of non-linear link functions makes equations difficult to solve analytically.
Likelihood functions are often complex and data-dependent.
Therefore, there does not exist an explicit solution for GLMs and thus numerical iterative optimization techniques are usually called in sequence.
The most common algorithm used in performing MLE for GLMs is IRLS. It reformulates the estimation problem such that it can be solved by applying a series of weighted least squares steps. Each iteration has the following general structure:
Each iteration follows a consistent pattern:
Compute predicted values using current coefficients
Calculate weights based on response variance
Update coefficients using weighted regression
The process repeats until model convergence is achieved.
IRLS is computationally efficient and widely used in:
R (glm() function)
Python (statsmodels GLM module)
Assumptions, Diagnostics & Goodness-of-Fit
Fitting a Generalized Linear Model (GLM) isn’t just about getting the numbers to work out. The real challenge—and where things get interesting—is making sure your model actually fits your data. Let’s dig into the main assumptions, the practical checks, and the ways to measure if your GLM is any good.
Key Assumptions of Generalized Linear Models
GLMs give you a lot of flexibility, but you still have to play by some rules. If you skip these, you risk ending up with results that just don’t hold up.
Correct response distribution
Your outcome has to follow one of the classic exponential family distributions—think Gaussian, Binomial, Poisson, or Gamma. Pick the wrong one, and your estimates take a hit. Predictions go off the rails fast.
Right link function
You need the right link function to connect the mean of your response variable to the linear predictor. If you mess this up, interpreting your model gets tricky, and your fit suffers.
Independence of observations
Every data point should stand on its own. That’s not always true, especially with time-series or grouped data. If you spot dependence, you’ll probably need to bring in mixed or hierarchical models.
Linearity in predictors (on the link scale)
Predictors should connect with the transformed mean response in a straight line. If you see curves or weird shapes, model them directly—don’t just hope they disappear.
Diagnostic Checks to Validate the Model
Diagnostics boil down to one question: Is your model doing what you want?
Residual analysis
Plot your deviance and Pearson residuals against fitted values or predictors. They should look random—no patterns. If you see structure, your model’s missing something.
Overdispersion
Count models (especially Poisson) often have more variance than theory says they should. That’s overdispersion, and if you ignore it, your standard errors turn unreliable.
Influential observations
Look at leverage and Cook’s distance to spot data points that push your model around too much. These deserve a closer look.
Goodness-of-Fit Measures
GLMs don’t hand you a simple R² like linear regression does. You need a mix of other tools.
Deviance
This tells you how well your model fits compared to a fully saturated model. Lower deviance means a better fit.
AIC and BIC
Akaike Information Criterion (AIC) and Bayesian Information Criterion (BIC) weigh model fit against complexity. Lower numbers are better—they mean you’re balancing fit without overcomplicating things.
Likelihood ratio tests
Use these to compare nested models. They answer whether adding more predictors really gives you a better fit.
Implementations in R/Python
It’s one thing to know what Generalized Linear Models are. But until you actually code them up, it’s all just theory. If you landed here looking for “GLM examples in Python or R,” you probably just want some code you can grab, play with, and run on your own data—no fuss.
So, let’s jump right in. We’ll look at real, working GLM code in both Python and R. First up: Python. The statsmodels library is a solid pick for this. It sticks pretty close to the textbook ideas, but it’s also straightforward. You get clear results, easy access to coefficients, and plenty of ways to check what’s going on inside your model—not just a bunch of predictions with no explanation.
A typical GLM workflow in Python looks like this:
Prepare your dataset and separate predictors from the response
Add a constant term to the predictors
Choose the correct GLM family
Fit the model and review the summary
Below is a simple example of logistic regression using a GLM, suitable for binary classification problems.
data = pd.DataFrame({ |
What makes this approach powerful is the output. You get coefficient estimates, p-values, deviance, and AIC—all of which help you evaluate model quality beyond accuracy alone.
Implementing GLMs in R Using glm()
R offers native support for GLMs, and the glm() function has been the industry standard for decades. Its formula-based syntax makes models easy to read and modify.
Here’s the same logistic regression example implemented in R:
data <- data.frame( |
Summary
R’s output is concise but informative, making it easy to interpret coefficients, standard errors, and significance levels. Switching between families—such as Poisson or Gamma—requires only a small change in the family argument.
Challenges, Limitations & Extensions of Generalised Linear Models
Generalized linear models are useful, but there are scenarios where they don't work. Problems like data errors, noise, and real-quality dataset problems make using core GLM insufficient. Being aware of these problems and knowing when and how to work with more advanced GLM techniques is key for building production-ready models instead of getting stuck in GLM failures.
1. Overdispersion and Zero-Inflation
If you’re dealing with count data and using something like Poisson regression, you’ll probably hit overdispersion first. Basically, the data bounces around way more than the model expects. That means your standard errors shrink too much and you end up with misleading results.
Some datasets are simply more complicated than others. Take for instance datasets with more zero counts than one would expect, like insurance claims or product defects. This is where GLM techniques are impressive. People can switch to negative binomial regression for models like ZIP (Zero Inflated Poisson regression) or ZINB (Zero Inflated Negative Binomial regression) for over-dispersed models to explain and predict these extra zeros.
2. Multicollinearity Among Predictors
GLMs also inherit a headache from linear regression: multicollinearity. When your predictors are packed too close together, your coefficients start acting weird—big standard errors, signs flipping out of nowhere, and the whole idea of “variable importance” gets fuzzy.
To tackle this, you could drop or combine features, use regularization like ridge or lasso, or do some smart feature engineering based on domain knowledge.
3. Assumption Sensitivity and Model Misspecification
GLMs depend on picking the right distribution and link function. Get this wrong, and your model quietly goes off track. Unlike tree-based models, GLMs don’t cut you much slack here, so you really need to check your diagnostics—look at residuals, run goodness-of-fit tests, and don’t just guess.
4. Trouble with Hierarchical or Correlated Data
GLMs assume every observation stands alone, but real data rarely works that way. Maybe you have repeated measurements, clusters, or groups. When that independence falls apart, standard GLMs just don’t cut it.
This is where generalized linear mixed models (GLMMs) step in. By adding random effects, you can model differences across groups and handle those within-cluster correlations, which helps a lot with data that has a multi-level or repeated structure.
5. Interpretability vs. Flexibility
GLMs are easy to explain—at least until you start adding stuff like zero-inflation, random effects, or heavy regularization. Each extension boosts performance, but it also makes the model trickier for others to understand. Finding the sweet spot between statistical rigor and clarity is always a balancing act.
Conclusion
Generalized linear models support machine learning and statistics by allowing very complex real-world problems to be broken down into smaller linear regression problems. GLMs serves as the foundation for models. In structured ways, they help machine learning practitioners tackle problems that fit the wide-range of problems classification and regression can solve, including predicting count-based problems. GLMs adjust to different underlyings probability distributions of the data. They are especially relevant in non-normally distributed problems though the sectors of finance, healthcare, marketing, and even social sciences.
Generalized linear models are an unexploited resource outside linear models to beauty and art. They come with many other weaker and stronger problems that require stong domain knowledge including the choice of distribution and the problems of correlation. Other domains have as a result of working with poor domain knowledge developed many ad-hoc methods that do not help the underlying problems including the construction of zero-inflated models and the use of mixed models. Generalized linear models themselves are very outperforming even the so-called black-box models. When a practitioner understands generalized linear models, they can easily construct very explainable continuous and reliable models.
They say data is the new oil, but it’s useless if you don't know how to refine it. Stop staring at spreadsheets and start predicting the future. Kickstart a high-paying career with our Data Science Master Program or build the engines that process massive data with Big Data Hadoop and Spark Developer Training.
FAQ's on Generalised Linear Models
1. What are generalized linear models?
Generalized linear models (GLM) are considered a wider range of regression models that go beyond linear regression. These models allow for the response variable to take on a distribution from the exponential family (e.g., binomial or Poisson) and relate to the predictors through a function other than direct scaling (i.e. a link function).
2. What are the key components of a GLM?
A GLM is built around three components. One is the distribution of response variable referred to as the error distribution. Another is the linear predictor. This is the function comprised of the input features and their coefficients. The last part is the link function. This part is the one that connects the linear predictor to the mean of the response variable.
3. What types of generalized linear models exist?
In practice GLMs are of logistic regression for a binary outcome, Poisson regression for count data, negative binomial regression for overdispersed counts, gamma regression for continuously positive data, and multinomial models for a multi-class classification problem.
4. How do you fit a GLM in Python?
Generalized linear models are implemented in Python in statsmodels. You would set up your model by providing it a formula and a distribution family, and then compute the parameter estimates afterward using the .fit() method of the model to do maximum likelihood estimation.
Table of Contents
- What are Generalized Linear Models (GLMs)
- Typical Examples of Generalized Linear Models
- Why Use Generalized Linear Models
- Core Components of GLMs
- Types of Generalized Linear Models
- Model Estimation and Fitting
- Assumptions, Diagnostics & Goodness-of-Fit
- Implementations in R/Python
- Challenges, Limitations & Extensions of Generalised Linear Models
- Conclusion
- FAQ's on Generalised Linear Models
What are Generalized Linear Models (GLMs)
Generalized Linear Models represent a significant upgrade to standard linear regression. They are specifically designed to work with data from the real world which cannot be represented by a line with normally distributed residuals. From a technical point of view, GLMs are the go-to choice in the areas of statistics, machine learning, data science, healthcare analytics, finance, and social sciences because they combine flexibility with interpretability.
Basically, GLMs are a set of statistical methods that relate the input variables to the output variable whose distribution might be non-normal.In contrast to single linear regression, GLM can efficiently handle binary outcomes, counts, rates, and even skewed data.They act as a bridge between classical statistics and machine learning by not losing the mathematical rigor and at the same time being applicable to the real world.
Generalized Linear Models operate on the principle that that they should have the following three components:
- Random Component: The variable that measures the response is to be drawn from a distribution of the exponential family (for instance, Binomial, Poisson, Gamma).
- Systematic Component: Predictor variables are to be combined linearly.
- Link Function: The function that links the linear predictor to the expected value of the response variable
Typical Examples of Generalized Linear Models
- Logistic Regression: It comes handy in cases where the results are binary such as yes/no or true/false.
- Poisson Regression: This model is conceptually the best match for count variables such as the number of times a website is visited or the number of events that occur over a certain period.
- amma Regression: Used mainly in situations where the data is continuous and positively skewed, for example, insurance claims or waiting times.
Check out this types of regression blog to know more about the models.
Why Should Anyone Care About GLMs?
One of their most important features is the fact that they can work with data that is not normally distributed.Besides that, they are easy to understand and are based on sound statistical principles.Moreover, they can be used for very simple analyses and at the same time, they can be the base of complex predictive models.Is there a chance that you had data and you tried to apply linear regression, but it just didn’t work and you were thinking that a more flexible model like GLM would do a better job?
Why Use Generalized Linear Models
Linear regression has its limits in practice
Traditional linear regression is effective when the dependent variable is continuous, normally distributed, and has a linear relationship with the independent variables. But, in the case of real-world data, it is hardly ever so tidy. Binary outcomes, count data, skewed distributions, and non-constant variance are the issues that most of the time violate these assumptions and thus lead to unreliable predictions and incorrect interpretations.
GLMs keep the door open for linear regression without losing interpretability
Generalized Linear Models (GLMs) keep the advantages of linear models (simplicity, understandability) and at the same time provide the models with more flexibility due to different probability distributions and link functions. So, one can model non-normal data precisely without having to go for complex black-box algorithms right away.
Better coping with real data-types
GLMs are the right answer when the failure of linear regression means:
– Binary outcomes (yes/no, success/failure) through logistic regression
– Count data (number of events, visits, clicks) by means of Poisson or negative binomial models
– Skewed positive values (time, cost, insurance claims) via gamma regression
This makes GLMs far more aligned with how data behaves in production systems.
Statistical robustness and reliable inference
Unlike many machine learning models, GLMs provide statistically meaningful coefficients, confidence intervals, and hypothesis tests. This is critical in regulated industries like healthcare, finance, and insurance, where explainability matters as much as accuracy.
Strong fit for business and operational use cases
GLMs are widely used in:
– Healthcare: disease risk prediction and patient outcome modeling
– Finance: credit scoring, default probability estimation
– Marketing: conversion modeling, click-through rate prediction
– Operations: demand forecasting and incident modeling
Scales well and integrates easily
GLMs are computationally efficient, scalable to large datasets, and have good support in R, Python (statsmodels), and enterprise ML platforms.
In case your data is not "perfect" for linear regression assumptions and you still want to have clarity, control, and statistical rigor, why compromise with an oversimplified model when a GLM can depict the situation more accurately?
Core Components of GLMs
1. Distribution (Random Component)
GLM doesnt require the target variable to be normally distributed. It is actually assumed to be from the exponential family of distributions which comprises:
- Normal
- Binomial
- Poisson
- Gamma
- Inverse Gaussian
This is the major advantage of generalized linear models that allow them to work well for: ( Binomial) Count data (number of events Poisson)Skewed continuous values (insurance claims, response time Gamma)By simply using the appropriate distribution GLMs depict the real data nature without forcing the data to fit a normal distribution.
Why it matters: Choosing the right distribution makes the model more understandable, less biased, and produces more reliable predictions.
2. Link Function (Systematic Component)
The link function connects the average value of the response variable with the linear predictor. It changes the output so that the predictions are still valid for the specified distribution.
Some of the frequently used link functions are:
Logit used in logistic regression for binary outcomesLog used in Poisson regression for count dataIdentity used when the relationship is already linearThe link function is the one that keeps model outputs within rational limits (e.g., probabilities between 0 and 1).
Why it matters: Many models would be impossible to run logically without this function because it controls the range of the outputs.
3. Linear Predictor (Deterministic Component)
The linear predictor looks familiar:
η = β₀ + β₁X₁ + β₂X₂ + … + βₙXₙ
- It represents a weighted combination of input features, just like in linear regression.
- What changes in GLMs is how this predictor relates to the outcome—via the link function instead of directly.
Why it matters:
This component keeps GLMs interpretable, allowing practitioners to understand feature influence while still modeling complex data behavior.
How These Components Work Together :
- The distribution defines what kind of data you are modeling
- The link function defines how predictions are transformed
- The linear predictor defines how inputs influence the outcome
- Together, they form a powerful, flexible modeling framework that balances statistical rigour with real-world practicality.
Types of Generalized Linear Models
1. Logistic Regression (Binary Outcomes)
Best for: Yes/No, True/False, Success/Failure type problems
Response distribution: Binomial
Link function: Logit
Typical usecases:
Spam detection (spam vs not spam)Disease diagnosis (positive vs negative)User churn predictionWhy it matters: Logistic regression is generally the first GLM that people learn as it directly provides classification solutions which are still statistically interpretable.
Poisson Regression (Count Data)
Good to have: Count, based outcomes where the values are non, negative integers
Response distribution: Poisson
Link function: Log
Typical use cases:
- Number of website visits per day
- Count of defects in manufacturing
- Accident frequency analysis
Key assumption: Mean ≈ Variance
Why it matters: If you are mostly interested in how many times something takes place rather than whether it takes place at all, then it is ideal.
2. Negative Binomial Regression (Overdispersed Counts)
Suitable for: Count data with high variance (overdispersion)
Response distribution: Negative Binomial
Link function: Log
Typical use cases:
- Insurance claim counts
- Social media engagement metrics
Why it matters: When Poisson regression fails due to overdispersion, this model steps in as a more flexible alternative.
Gamma Regression (Positive Continuous Data)
Best for: Continuous values that are strictly positive and skewed
Response distribution: Gamma
Link function: Log or Inverse
Typical use cases:
- Insurance claim amounts
- Time-to-completion data
- Medical cost modeling
Why it matters: Gamma regression handles skewed distributions much better than linear regression.
3. Gaussian (Normal) GLM
Best for: Continuous data with normal distribution
Response distribution: Gaussian
Link function: Identity
Typical use cases:
Traditional regression problems
Why it matters: This is essentially linear regression under the GLM framework, showing how GLMs generalize classical methods.
4. Inverse Gaussian Regression
Best for: Positively skewed time-based data
Typical use cases:
- Survival analysis
- Reaction time modeling
Why it matters: Useful when variance increases with the mean in a non-linear way.
Multinomial and Ordinal GLMs
Best for: Multiple categories or ordered outcomes
Typical use cases:
- Customer satisfaction ratings
- Product choice modeling
Why it matters: These models extend GLMs beyond binary decisions.
Model Estimation and Fitting
Model Estimation and Fitting in Generalized Linear Models (MLE & IRLS)
Purpose of model estimation in GLMs
- Estimation defines how a generalized linear model learns from data.
- Unlike linear regression, GLMs handle non-normal response distributions.
- The estimation process must align with both:
- The assumed probability distribution
- The chosen link function
- Well-fitted parameters ensure interpretability, statistical validity, and stable predictions.
Maximum Likelihood Estimation (MLE)
MLE is the core statistical principle used to estimate GLM parameters.
The objective is to find coefficient values that maximize the likelihood of observed data.
Key characteristics of MLE in GLMs:
- Works with distributions from the exponential family
- Optimizes the log-likelihood instead of squared errors
Produces statistically meaningful outputs such as:
- Coefficient estimates
- Standard errors
- Confidence intervals
- Hypothesis tests
- MLE naturally adapts to different GLM types, including logistic and Poisson regression.
Why GLMs lack closed-form solutions
- The presence of non-linear link functions makes equations difficult to solve analytically.
- Likelihood functions are often complex and data-dependent.
- Therefore, there does not exist an explicit solution for GLMs and thus numerical iterative optimization techniques are usually called in sequence.
The most common algorithm used in performing MLE for GLMs is IRLS. It reformulates the estimation problem such that it can be solved by applying a series of weighted least squares steps. Each iteration has the following general structure:
Each iteration follows a consistent pattern:
- Compute predicted values using current coefficients
- Calculate weights based on response variance
- Update coefficients using weighted regression
- The process repeats until model convergence is achieved.
- IRLS is computationally efficient and widely used in:
- R (glm() function)
- Python (statsmodels GLM module)
Assumptions, Diagnostics & Goodness-of-Fit
Fitting a Generalized Linear Model (GLM) isn’t just about getting the numbers to work out. The real challenge—and where things get interesting—is making sure your model actually fits your data. Let’s dig into the main assumptions, the practical checks, and the ways to measure if your GLM is any good.
Key Assumptions of Generalized Linear Models
GLMs give you a lot of flexibility, but you still have to play by some rules. If you skip these, you risk ending up with results that just don’t hold up.
- Correct response distribution
Your outcome has to follow one of the classic exponential family distributions—think Gaussian, Binomial, Poisson, or Gamma. Pick the wrong one, and your estimates take a hit. Predictions go off the rails fast.
- Right link function
You need the right link function to connect the mean of your response variable to the linear predictor. If you mess this up, interpreting your model gets tricky, and your fit suffers.
- Independence of observations
Every data point should stand on its own. That’s not always true, especially with time-series or grouped data. If you spot dependence, you’ll probably need to bring in mixed or hierarchical models.
- Linearity in predictors (on the link scale)
Predictors should connect with the transformed mean response in a straight line. If you see curves or weird shapes, model them directly—don’t just hope they disappear.
Diagnostic Checks to Validate the Model
Diagnostics boil down to one question: Is your model doing what you want?
- Residual analysis
Plot your deviance and Pearson residuals against fitted values or predictors. They should look random—no patterns. If you see structure, your model’s missing something.
- Overdispersion
Count models (especially Poisson) often have more variance than theory says they should. That’s overdispersion, and if you ignore it, your standard errors turn unreliable.
- Influential observations
Look at leverage and Cook’s distance to spot data points that push your model around too much. These deserve a closer look.
Goodness-of-Fit Measures
GLMs don’t hand you a simple R⊃2; like linear regression does. You need a mix of other tools.
- Deviance
This tells you how well your model fits compared to a fully saturated model. Lower deviance means a better fit.
- AIC and BIC
Akaike Information Criterion (AIC) and Bayesian Information Criterion (BIC) weigh model fit against complexity. Lower numbers are better—they mean you’re balancing fit without overcomplicating things.
- Likelihood ratio tests
Use these to compare nested models. They answer whether adding more predictors really gives you a better fit.
Implementations in R/Python
It’s one thing to know what Generalized Linear Models are. But until you actually code them up, it’s all just theory. If you landed here looking for “GLM examples in Python or R,” you probably just want some code you can grab, play with, and run on your own data—no fuss.
So, let’s jump right in. We’ll look at real, working GLM code in both Python and R. First up: Python. The statsmodels library is a solid pick for this. It sticks pretty close to the textbook ideas, but it’s also straightforward. You get clear results, easy access to coefficients, and plenty of ways to check what’s going on inside your model—not just a bunch of predictions with no explanation.
A typical GLM workflow in Python looks like this:
- Prepare your dataset and separate predictors from the response
- Add a constant term to the predictors
- Choose the correct GLM family
- Fit the model and review the summary
Below is a simple example of logistic regression using a GLM, suitable for binary classification problems.
|
data = pd.DataFrame({ |
What makes this approach powerful is the output. You get coefficient estimates, p-values, deviance, and AIC—all of which help you evaluate model quality beyond accuracy alone.
Implementing GLMs in R Using glm()
R offers native support for GLMs, and the glm() function has been the industry standard for decades. Its formula-based syntax makes models easy to read and modify.
Here’s the same logistic regression example implemented in R:
|
data <- data.frame( |
Summary
R’s output is concise but informative, making it easy to interpret coefficients, standard errors, and significance levels. Switching between families—such as Poisson or Gamma—requires only a small change in the family argument.
Challenges, Limitations & Extensions of Generalised Linear Models
Generalized linear models are useful, but there are scenarios where they don't work. Problems like data errors, noise, and real-quality dataset problems make using core GLM insufficient. Being aware of these problems and knowing when and how to work with more advanced GLM techniques is key for building production-ready models instead of getting stuck in GLM failures.
1. Overdispersion and Zero-Inflation
If you’re dealing with count data and using something like Poisson regression, you’ll probably hit overdispersion first. Basically, the data bounces around way more than the model expects. That means your standard errors shrink too much and you end up with misleading results.
Some datasets are simply more complicated than others. Take for instance datasets with more zero counts than one would expect, like insurance claims or product defects. This is where GLM techniques are impressive. People can switch to negative binomial regression for models like ZIP (Zero Inflated Poisson regression) or ZINB (Zero Inflated Negative Binomial regression) for over-dispersed models to explain and predict these extra zeros.
2. Multicollinearity Among Predictors
GLMs also inherit a headache from linear regression: multicollinearity. When your predictors are packed too close together, your coefficients start acting weird—big standard errors, signs flipping out of nowhere, and the whole idea of “variable importance” gets fuzzy.
To tackle this, you could drop or combine features, use regularization like ridge or lasso, or do some smart feature engineering based on domain knowledge.
3. Assumption Sensitivity and Model Misspecification
GLMs depend on picking the right distribution and link function. Get this wrong, and your model quietly goes off track. Unlike tree-based models, GLMs don’t cut you much slack here, so you really need to check your diagnostics—look at residuals, run goodness-of-fit tests, and don’t just guess.
4. Trouble with Hierarchical or Correlated Data
GLMs assume every observation stands alone, but real data rarely works that way. Maybe you have repeated measurements, clusters, or groups. When that independence falls apart, standard GLMs just don’t cut it.
This is where generalized linear mixed models (GLMMs) step in. By adding random effects, you can model differences across groups and handle those within-cluster correlations, which helps a lot with data that has a multi-level or repeated structure.
5. Interpretability vs. Flexibility
GLMs are easy to explain—at least until you start adding stuff like zero-inflation, random effects, or heavy regularization. Each extension boosts performance, but it also makes the model trickier for others to understand. Finding the sweet spot between statistical rigor and clarity is always a balancing act.
Conclusion
Generalized linear models support machine learning and statistics by allowing very complex real-world problems to be broken down into smaller linear regression problems. GLMs serves as the foundation for models. In structured ways, they help machine learning practitioners tackle problems that fit the wide-range of problems classification and regression can solve, including predicting count-based problems. GLMs adjust to different underlyings probability distributions of the data. They are especially relevant in non-normally distributed problems though the sectors of finance, healthcare, marketing, and even social sciences.
Generalized linear models are an unexploited resource outside linear models to beauty and art. They come with many other weaker and stronger problems that require stong domain knowledge including the choice of distribution and the problems of correlation. Other domains have as a result of working with poor domain knowledge developed many ad-hoc methods that do not help the underlying problems including the construction of zero-inflated models and the use of mixed models. Generalized linear models themselves are very outperforming even the so-called black-box models. When a practitioner understands generalized linear models, they can easily construct very explainable continuous and reliable models.
They say data is the new oil, but it’s useless if you don't know how to refine it. Stop staring at spreadsheets and start predicting the future. Kickstart a high-paying career with our Data Science Master Program or build the engines that process massive data with Big Data Hadoop and Spark Developer Training.
FAQ's on Generalised Linear Models
1. What are generalized linear models?
Generalized linear models (GLM) are considered a wider range of regression models that go beyond linear regression. These models allow for the response variable to take on a distribution from the exponential family (e.g., binomial or Poisson) and relate to the predictors through a function other than direct scaling (i.e. a link function).
2. What are the key components of a GLM?
A GLM is built around three components. One is the distribution of response variable referred to as the error distribution. Another is the linear predictor. This is the function comprised of the input features and their coefficients. The last part is the link function. This part is the one that connects the linear predictor to the mean of the response variable.
3. What types of generalized linear models exist?
In practice GLMs are of logistic regression for a binary outcome, Poisson regression for count data, negative binomial regression for overdispersed counts, gamma regression for continuously positive data, and multinomial models for a multi-class classification problem.
4. How do you fit a GLM in Python?
Generalized linear models are implemented in Python in statsmodels. You would set up your model by providing it a formula and a distribution family, and then compute the parameter estimates afterward using the .fit() method of the model to do maximum likelihood estimation.
Categories
Related Posts

Fundamentals of Data Visualization Explained
Tue, 16 April 2024

What is Data Visualization? A Comprehensive Guide
Mon, 08 April 2024

Top 10 Data Visualization Tips for Clear Communication
Fri, 31 May 2024

Data Visualization Strategy and its Importance
Wed, 10 April 2024

Top 10 Best Data Science Frameworks: For Organizations
Thu, 11 April 2024

Data Science Frameworks: A Complete Guide
Mon, 15 April 2024

How to Create Data Visualizations in Excel: A Brief Guide
Wed, 11 September 2024

How to repair a crashed MySQL table?
Wed, 13 August 2025

5 Popular Data Science Careers That Are in Demand
Fri, 29 August 2025