What Maintenance KPIs Do Managers Use for Smarter Resource Allocation?
Tue, 07 July 2026

Follow the stories of academics and their research expeditions
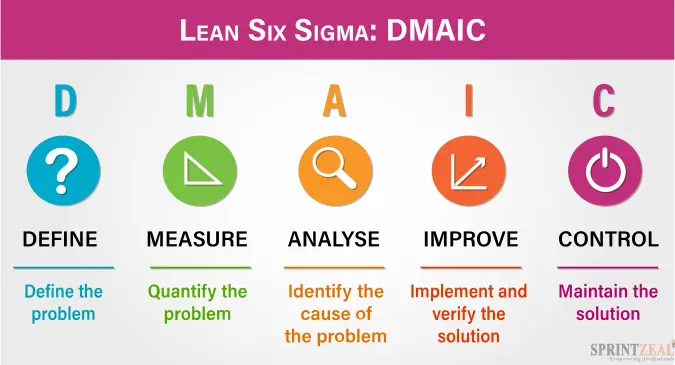
DMAIC is an acronym for Define, Measure, Analyze, Improve, and Control. The DMAIC methodology is a systematic problem-solving methodology widely used in Lean Six Sigma projects to enhance processes and improvements. DMAIC tools help practitioners navigate each phase of this structured approach.
Defining DMAIC Tools
DMAIC tools encompass a diverse set of techniques and methodologies designed to assist in specific phases of the DMAIC process. These tools serve as valuable aids for data collection, analysis, and decision-making, ultimately contributing to the successful execution of Lean Six Sigma projects.
Let’s dive in and understand the tools used for each of the 5 DMAIC phases and explore how they help in Lean Six Sigma projects.
Effective process improvement relies on choosing the right tools for each step of the DMAIC approach. Every phase demands specific tools to tackle its particular challenges. In this section, we'll explore the top five tools for each phase, explaining how they're used and why they matter for making processes better and ensuring top-notch quality in organizations.
In the Define phase of the DMAIC methodology, the primary objective is to establish a clear understanding of the problem, project goals, and scope. This phase sets the stage for the entire project, and five key DMAIC tools assist in achieving these critical objectives:
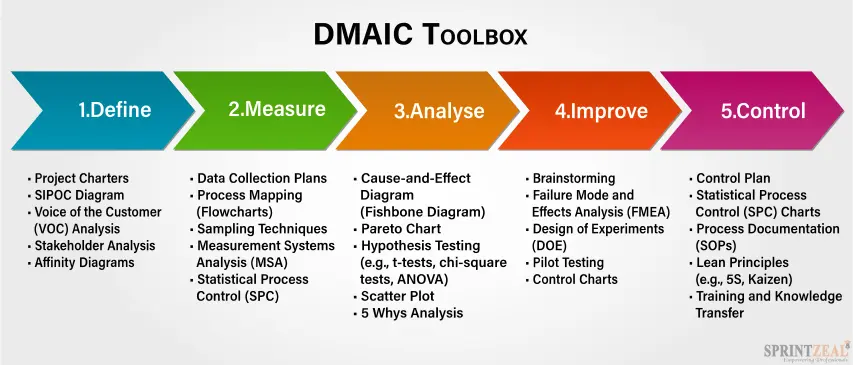
1. Project Charter
What is a Project Charter? A project charter is a foundational document that outlines the purpose, scope, objectives, and key stakeholders of the project. It serves as a roadmap, providing clarity and direction from the very beginning.
How it helps:
2. SIPOC Diagram
What is a SIPOC Diagram? The SIPOC (Suppliers, Inputs, Process, Outputs, Customers) diagram is a visual representation that provides an overview of the high-level process flow, including its inputs, outputs, and key stakeholders. It is instrumental in identifying areas that require improvement.
How it Helps:
3. Voice of the Customer (VOC) Analysis
What is VOC Analysis? Understanding the customer's needs and expectations is paramount. VOC analysis tools, such as surveys, interviews, and direct feedback collection, help gather customer insights and translate them into actionable project goals.
How it Helps:
4. Affinity Diagram
What is an Affinity Diagram? An affinity diagram is a tool used to organize and group large amounts of unstructured information or ideas into meaningful categories. It is particularly useful when dealing with complex or unclear problem statements.
How it Helps:
5. Stakeholder Analysis
What is Stakeholder Analysis? Stakeholder analysis is a systematic process of identifying and assessing the interests, influence, and potential impact of individuals or groups that have an interest in the project.
How it Helps:
In the Define phase, these five DMAIC tools play a pivotal role in laying a solid foundation for your Lean Six Sigma project. They facilitate the process of defining the problem, project scope, and stakeholder expectations, all of which are essential for a successful project journey.
In the Measure phase of the DMAIC methodology, the primary focus is on collecting and analyzing data to establish the current state of the process. The following DMAIC tools are instrumental in achieving these objectives:
1. Data Collection Plan
What is a Data Collection Plan? A data collection plan is a structured document that outlines what data needs to be collected, how it will be collected, when it will be collected, and who will be responsible for data gathering. It ensures that data is collected systematically and accurately.
How it Helps:
2. Process Mapping
What is Process Mapping? Process mapping tools like flowcharts and value stream maps provide a visual representation of the process. They help in understanding the sequence of steps, inputs, and outputs in the process.
How it Helps:
3. Measurement Systems Analysis (MSA)
What is Measurement Systems Analysis (MSA)? MSA tools assess the accuracy, precision, and reliability of measurement systems to ensure that collected data is trustworthy. Common MSA techniques include Gage R&R (Repeatability and Reproducibility) studies.
How it Helps:
4. Histograms and Frequency Plots
What are Histograms and Frequency Plots? Histograms and frequency plots are graphical tools used to display the distribution of data. Histograms provide a visual representation of data distribution, while frequency plots show how data points are distributed across different categories or bins.
How they Help:
5. Process Capability Analysis
What is Process Capability Analysis? Process capability analysis assesses the ability of a process to consistently produce products or services that meet customer specifications. Common metrics used in process capability analysis include Cp, Cpk, Pp, and Ppk.
How it Helps:
The Analyze phase of the DMAIC methodology focuses on identifying the root causes of problems and gaining insights into process behavior. To achieve these objectives, various DMAIC tools are employed:
1. Cause-and-Effect Diagram (Fishbone Diagram)
What is a Cause-and-Effect Diagram? Also known as a Fishbone or Ishikawa diagram, this tool helps visualize potential causes of a problem. It resembles a fishbone, with the problem statement at the "head" and branches representing different categories of potential causes.
How it Helps:
2. Pareto Chart
What is a Pareto Chart? A Pareto chart is a bar chart that prioritizes issues or causes by showing which factors contribute the most to a problem. It follows the Pareto principle, suggesting that a small number of causes (the "vital few") often account for the majority of the problems.
How it Helps:
3. Hypothesis Testing
What is Hypothesis Testing? Hypothesis testing involves using statistical methods to analyze data and test hypotheses about potential root causes. Common tests include t-tests, chi-square tests, and ANOVA (Analysis of Variance).
How it Helps:
4. Scatter Plot
What is a Scatter Plot? A scatter plot displays data points on a two-dimensional graph, with one variable on the x-axis and another on the y-axis. It is used to explore relationships and correlations between variables.
How it Helps:
5. Five Whys Analysis
What is 5 Whys Analysis? The 5 Whys technique involves repeatedly asking "Why?" to dig deeper into the root cause of a problem. By asking "Why?" five times (or more), it aims to uncover the underlying issues.
How it Helps:

In the Improve phase of the DMAIC methodology, the focus shifts to developing and implementing solutions to address the root causes identified during the Analyze phase. The following DMAIC tools and techniques are instrumental in driving process improvement:
1. Brainstorming
What is Brainstorming? Brainstorming is a creative problem-solving technique that involves generating a wide range of ideas and potential solutions. Team members collaborate to explore innovative ways to address identified issues.
How it Helps:
2. Failure Mode and Effects Analysis (FMEA)
What is FMEA? FMEA is a systematic approach to evaluating potential failure modes within a process and their potential impact. It assigns scores for Severity, Occurrence, and Detection to prioritize which failure modes to address first.
How it Helps:
3. Design of Experiments (DOE)
What is Design of Experiments (DOE)? DOE is a statistical technique used to systematically vary and analyze multiple factors simultaneously to optimize a process. It helps identify the ideal combination of factors that produce the desired outcomes.
How it Helps:
4. Pilot Testing
What is Pilot Testing? Pilot testing involves implementing proposed process improvements on a smaller scale before full-scale implementation. It allows for testing and refinement of solutions while minimizing risk.
How it Helps:
5. Control Charts
What are Control Charts? Control charts are graphical tools used to monitor and visualize process performance over time. They help identify trends, shifts, or abnormal variations in the process.
How they Help:
1. Control Charts
What are Control Charts? Control charts are graphical tools used to monitor and visualize process performance over time. They help identify trends, shifts, or abnormal variations in the process.
How they Help:
2. Statistical Process Control (SPC) Charts
What are SPC Charts? SPC charts, including control charts and run charts, are used to monitor process stability and identify variations. They provide a visual representation of data over time.
How they Help:
3. 5S Methodology
What is the 5S Methodology? The 5S methodology focuses on organizing and maintaining a clean, efficient, and safe work environment. It comprises five principles: Sort, Set in order, Shine, Standardize, and Sustain.
How it Helps:
4. Poka-Yoke (Mistake-Proofing)
What is Poka-Yoke? Poka-Yoke refers to error-proofing or mistake-proofing techniques designed to prevent errors and defects during the production or operation of a process. These can include simple mechanisms or processes that prevent mistakes.
How it Helps:
5. Standard Operating Procedures (SOPs)
What are Standard Operating Procedures (SOPs)? SOPs are documented step-by-step instructions that detail how specific tasks or processes should be performed. They provide a consistent and standardized approach to tasks.
How they Help:
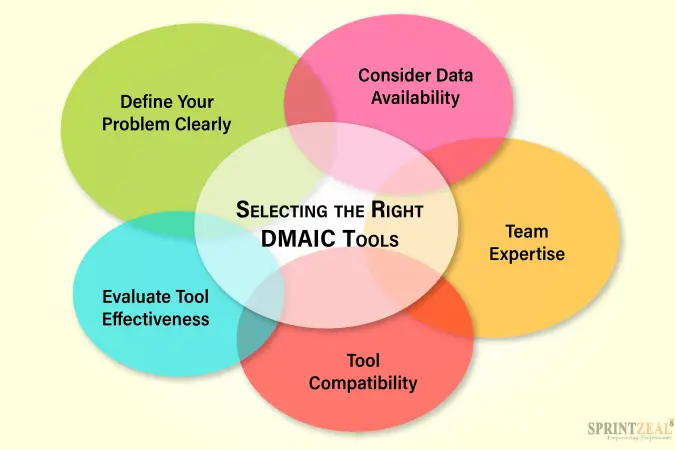
Selecting the right DMAIC tools is crucial for the success of your Lean Six Sigma project. The choice of tools should be driven by the specific objectives of each phase and the nature of the problem you're addressing. Here's a guide to help you select the most appropriate tools for your project:
- Define Your Problem Clearly
Before choosing DMAIC tools, ensure you have a clear and concise understanding of the problem you're trying to solve. Define the problem statement, its scope, and the goals of your project. This clarity will guide your tool selection.
- Consider the DMAIC Phase
Different phases of the DMAIC process require different tools. For example:
- Consider Data Availability
The availability of data can influence your tool selection. If data is limited, focus on tools that can work with the available data or consider data collection methods for missing information.
- Team Expertise
Assess the expertise of your project team. Some tools may require specialized knowledge or training. Ensure that your team is comfortable using the selected tools or invest in training if needed.
- Tool Compatibility
Ensure that the chosen DMAIC tools are compatible with your organization's systems and processes. This includes considering software compatibility, data integration, and overall alignment with existing practices.
- Evaluate Tool Effectiveness
Regularly evaluate the effectiveness of the tools you're using. If a tool is not producing the desired results or insights, be open to adjusting your approach and considering alternative tools.
- Seek Guidance
Don't hesitate to seek guidance from experienced Lean Six Sigma practitioners, mentors, or consultants. They can provide valuable insights into which tools are best suited to your specific project and organizational context.
- Documentation
Document your tool selection process and rationale. This documentation will not only help you make informed decisions but also serve as a reference for future projects.
Remember that the effectiveness of DMAIC tools relies on their appropriate application within the context of your project. Selecting the right tools and using them effectively is a key factor in achieving successful outcomes and process improvements.
Best DMAIC Tools for Analyze Phase?
Some of the best DMAIC tools commonly used in the Analyze phase include:
What Tools Are Most Commonly Used in DMAIC?
DMAIC involves a wide range of tools, and the choice of tools depends on the specific phase of the DMAIC process and the nature of the problem being addressed. However, some commonly used tools across the DMAIC phases include:
What Is the Purpose of DMAIC Tools?
The purpose of DMAIC tools is to provide a structured and systematic approach to problem-solving and process improvement. These tools help organizations:
DMAIC tools promote data-driven decision-making and continuous improvement within an organization.
Is DMAIC a Problem-Solving Tool?
DMAIC (Define, Measure, Analyze, Improve, Control) is not a single problem-solving tool but a comprehensive problem-solving methodology used in Lean Six Sigma. It incorporates a wide range of tools and techniques at each phase to address specific aspects of process improvement and problem-solving. DMAIC provides a structured framework for identifying, analyzing, and resolving problems to enhance process performance and quality.
Improving your expertise in DMAIC tools and Lean Six Sigma methods is a valuable journey that can greatly benefit your career and your company's achievements. Lean Six Sigma Certification Training is the path to gaining this expertise in a structured and hands-on way.
Sprintzeal's Lean Six Sigma Certification Training is your gateway to achieving expertise in a structured and practical manner.
Our comprehensive training programs provide an in-depth understanding of DMAIC tools, principles, and methodologies. You'll gain hands-on experience, working on real projects that empower you to confidently apply DMAIC tools in your workplace. With a strong emphasis on problem-solving and critical-thinking skills, our training equips you to identify and address process issues efficiently.
Quality optimization and career advancement await you. Sprintzeal's Lean Six Sigma Certification opens doors to new opportunities, positioning you as a valued professional in quality management, process improvement, and leadership roles. Don't miss your chance to become a Lean Six Sigma expert—visit our Lean Six Sigma Certification Training page to embark on your DMAIC tools mastery journey with Sprintzeal today.
In this guide, we've explored DMAIC tools, pivotal in Lean Six Sigma methodology. From Define to Control, these tools empower organizations to enhance efficiency and deliver higher-quality products and services. Applying the right tool at the right time is the key to identifying root causes and achieving sustained improvements. Now, let's take your understanding of DMAIC tools further by considering Lean Six Sigma Certification Training.
In conclusion, DMAIC tools are vital for process improvement and quality optimization across diverse industries. Their universal applicability makes them a critical asset for organizations striving to reduce costs and enhance product and service delivery.
Consider taking your knowledge of DMAIC tools to the next level through Lean Six Sigma Certification Training. Sprintzeal offers comprehensive training programs designed to equip you with the expertise needed to excel in process improvement. Our experienced instructors, practical projects, and respected certifications validate your proficiency in DMAIC tools and Lean Six Sigma methodologies.

Visit our home page Sprintzeal.com to explore your options and start your path to excellence in process improvement and quality optimization. Your DMAIC tools mastery journey begins here.
Tue, 07 July 2026
Mon, 06 July 2026

© 2026 Sprintzeal Americas Inc. - All Rights Reserved.