Cloud Providers: Types, Features & Choosing The Right One
Mon, 13 July 2026
Follow the stories of academics and their research expeditions
Choosing between Power BI and Tableau is no longer just about the features. Now it’s about how well a tool fits your business environment, data complexity, and long-term goals. 2026 sees both tools continuing to dominate the BI space, but with the different audiences.
Power BI has become the first choice of almost every organization that is deeply embedded in the Microsoft ecosystem as it offers integration with Excel, Azure, and Microsoft 365 at a very competitive price. Tableau, on the other hand, is a great solution when it comes to flexibility, advanced visual analytics, and handling large, complex datasets, which is why it's a favourite in data-heavy and enterprise environments.
This article is for SMBs looking for cost-effective BI large enterprises dealing with big data and data analysts who want to improve their visualization skills. Career changers who are deciding between tableau bi or Power BI for their future job growth. You will have a practical and experienced, backed tableau power bi comparison of capabilities, strengths, and real-life examples, instead of top-level opinions.
So, which tool, really, makes sense for you in 2026? More importantly, which one fits the way you work with, analyze, and grow through the data? At the end of this guide, you will know the answer crystal clear from the marketing hype.
Power BI is a business intelligence and data visualization tool developed by Microsoft that is meant to allow businesses to turn raw data into useful insights. Fundamentally, Power BI is a tool that helps users connect different datasets, clean, and model their data before presenting it through reports and dashboards. In relation to the ongoing debate about Tableau versus Power BI, Power BI is widely preferred by teams that demand speed with minimal setup, especially when Microsoft is a driving force behind an entity.
One of the major advantages of Power BI lies in its feature set. It allows users to create highly interactive dashboards and utilize features such as real-time reporting and powerful data modeling using DAX (Data Analysis Expressions).
For more details on Data Modeling refer to this interview questions blog for more detailed analysis.
Inbuilt features such as natural language query support, automated insights, and smart visualization assist users. When comparing power bi vs tableau power bi uses, we can see that Power BI offers special importance to ease of usage and quick dashboard development. Does it make sense why finance and operations teams love Power BI so much? Among all other tableau bi tools, one reason lies in its usage.
Another area where Power BI excels is through its ecosystem. It offers a seamless integration with Microsoft 365, Excel, Azure, and SQL Server, enabling enterprises to utilize existing infrastructure with no problems at all. Unlike Tableau, which offers a wide but also complicated ecosystem, Power BI offers a connected and affordable BI solution that is also scalable for growing businesses.
Tableau is recognized as a prominent business intelligence and data visualization software that can help businesses effectively transform complex data into clear and interactive visualizations. While discussing the comparison of power BI vs Tableau, it is sometimes considered that Tableau is the top choice for those businesses that require in-depth data exploration, high-level data visualization, and many other important data-related tools.
At its core, Tableau provides a family of products that include Tableau Desktop, Tableau Server, and Tableau Cloud, which function together to provide something referred to as the analytics lifecycle. Tableau Desktop is where the analyst interacts with the data and where they create the visualizations with Tableau.Likewise, Tableau Server and Tableau Cloud make sharing the created dashboards easy and ensure that decision-makers always have the latest available information.
One of the greatest strengths of Tableau is that it has very advanced tools pertaining to visual analytics. The drag-and-drop interface offered by Tableau enables free exploration of data and allows “what-if” scenarios to be asked. This makes Tableau’s BI tool very appropriate in cases where there is a need to deal with huge data sets.
Comparing the two visualisation tools – Power BI and Tableau – generally comes down to the complexity you need versus the insights you desire.
Power BI is a much stronger choice when it comes to price. With a free version for desktop use and a relatively affordable Pro version, Power BI is perfect for new startups and mid-sized teams. Tableau BI, by contrast, is a premium business intelligence tool, which means that while it costs more, for an enterprise dealing with high volumes of data, it is worth it.
Power BI is created with the intent of fast adoption, especially if you are already familiar with Excel or other Microsoft products. Tableau Power BI comparisons will frequently point out that the learning curve for Tableau is more difficult; however, it also offers more possibilities for creative freedom to an advanced user.
Tableau BI is excellent for handling huge amounts of data and complex analytics. Power BI is also quite efficient for handling the majority of a business’s needs, though very large models may need to be fine-tuned.
Tableau's flexibility and personalization capacity for visualization and storytelling are unparalleled. Power BI emphasizes dashboards and business reporting.
Select Power BI if you want speed, cost, and Microsoft. Select Tableau if you want analysis and visualization precision. What matters most to you? Is it ease of use or analysis?
Picking one of the two usually comes down to the built in capabilities. Each product is strong but each suits a different kind of analyst and a different level of technical detail.
Data sources you can reach
Power BI besides Tableau connect to SQL engines, Excel workbooks, AWS, Azure, Google BigQuery and to live streams. Power BI slips straight into a Microsoft setup - Excel, Azure SQL or SharePoint talk to it without extra steps. Tableau copes better with mixed plus very large data that sit in multiple clouds - it offers more options when the data estate is scattered.
How you shape the numbers
Power BI leans on DAX, a formula language that is rich but terse - newcomers often pause before they trust it. Tableau adds calculated fields and shows the transformation on screen - the user sees the effect of each step. Decide whether you want to type formulas or to drag coloured blocks.
Screens you show to colleagues
Either package publishes interactive charts - power BI stresses speed and a layout that a finance team can read right away. Tableau gives the designer finer control over colour, size but also sequence - a long narrative can unfold in one view. When the brief is to guide the reader through a story, Tableau offers more room to speak.
Power BI Desktop: Free (individual use only)
Power BI Pro: ≈ $10 per user/month (full share & collaboration features)
Power BI Premium Per User (PPU): ≈ $20 per user/month (advanced analytics & larger models)
Power BI Premium (Capacity): starts at ≈ $4,995 per month (organisation-wide dedicated capacity)
Tableau BI is priced per user, billed annually unless otherwise specified
Tableau Viewer: ≈ $15 per user/month
Tableau Explorer: ≈ $42 per user/month
Tableau Creator: ≈ $75 per user/month
Tableau also offers Enterprise editions with higher pricing (e.g., Creator up to $115/month) depending on scale and features
Handling Large & Complex Datasets
It has been found that Tableau BI tools are good at handling large volumes of complex data with live connections to technologies such as Snowflake, Redshift, and Hadoop. Power BI relies significantly on its in-memory database named VertiPaq. Thus, there is a guarantee of high performance with optimized data, while extra effort is required while working with large and unoptimized data.
Speed, Refresh Rates, and Stability
Further, Power BI has strong integration with Microsoft products like Azure and SQL Server, which translates into better refresh speed during scheduled data refreshes. Tableau offers real-time connections as well as extracts. However, during complex queries or joins, the refresh speed can be affected. Both tools enjoy strong stability figures, and hence tableau power bi comparisons often draw a similar conclusion of both tools being equally reliable.
Cloud & Enterprise Scalability
For cloud scalability, the option of dedicated capacity is available in Power BI Premium, making it easier to handle increases in user and capacity scalability across various departments. For Tableau, the options of Tableau Cloud and Server with multiple node deployment options exist, which can cater to the needs of big businesses. The key differentiation will obviously be the infrastructure, where the ‘Microsoft-first’ option will naturally choose the Power BI, while heterogeneous environments lean toward Tableau
A reason for the debate on tableau vs power bi visualization is that, essentially, both of these tools shine when it comes to the arena of visual storytelling.
Built-in Visuals & Custom Charts
Tableau BI has always been popular mainly for the ease of use of its drag, and, drop feature, coupled with very powerful visuals options. Analysts can create very complex charts easily and without any help of third, party plugins. Power BI has upgraded the competition significantly by making available very solid native visuals and even a full marketplace for custom visuals. While Tableau may be considered more flexible right from the start, Power BI gets quite close in terms of customization.
Advanced Analytics & AI Features
Power BI is packed with AI, powered features such as automated insights, natural language queries, and forecasting, which help to bring sophisticated analytics within the reach of non, technical users. Meanwhile, Tableau is more centered on visual exploration and providing a deeper statistical level, thus giving a skilled analyst more control.
Guided insights or analytical freedom?
Storytelling with Data Tableau has a unique talent for exploratory storytelling, where it interactively leads the audience through data narratives. Power BI, by and large, tends to concentrate on business reporting and executive dashboards, thus, making the insights more consumable. Comparing Power BI vs Tableau in storytelling, one may say that Tableau is more 'artistic', whereas Power BI is more 'structured'.
Ease of adoption is a key factor, particularly in the context of teams that seek to scale their analytics capabilities.
Beginner Friendliness
Power BI, in my opinion, is more accessible as a beginner's interface, especially for people who work with Excel or Microsoft software in general. It seems more intuitive and business-like in its interface. Tableau is more difficult to learn, but ultimately more flexible in its analysis once you get the hang of it.
Learning Resources & Community
Support Both tools have strong communities and learning systems. Power BI also benefits from the large Microsoft corporate ecosystem and the Microsoft Learn system, while Tableau has a very passionate global community surrounding the tool and extensive learning material concerning visualization. Skill Requirements for Professionals For professionals, BI in Tableau tends to require more analytical and visualization skills, Power BI more modeling concepts and DAX capabilities. The decision comes down to aspirations and objectives – are they purely business-focused, or is the goal more complex, advanced visualization?
Power BI has gained much popularity due to seamless integration with Microsoft applications, thus becoming an ideal choice for companies that are already invested in Office 365, Azure, and Dynamics applications. Finance teams use Power BI to perform real-time financial reporting, create budgets, and track key performance indicators (KPIs). For operations, Power BI is utilized for supply chain performance, inventory, and efficiency improvement, where dashboards are created to track various operations. Small and medium-sized companies are attracted to Power BI due to its effective cost, as it allows companies to deploy dashboards quickly without involving IT departments, thus simplifying its usability in many business environments. Moreover, companies that rely on Microsoft applications have chosen Power BI as it simplifies the process and enhances efficiency, as it has become an ideal platform for companies that are seeking consolidated information for human resources, sales, and operations, thus saving on cost and efficiency, especially for companies relying on Microsoft applications.
On the other side of the spectrum, tableau bi is often the default choice when enterprises and analytics teams value data storytelling and exploration the most. Within the industries of health care, retail analytics, and global consulting, enterprises require a high level of complex data relationships to be properly mapped out and illustrated for decision-making leadership teams. Here, in lies the benefit of the visualisation tools offered within tableau bi; enterprises that operate with a strong analytics team and require the depth of analysis within a multitude of data sources choose tableau bi due to its capability to accommodate live connections necessary within the field of data science. Thus, within the realm of large enterprise analytics solutions, tableau bi stands as a strong default solution for enterprises that value depth within ad hoc analysis and other aspects of customised exploration.
Power BI Professionals
Power BI Developers & Analysts usually earn within a yearly range of $90,000 - $150,000+, while more senior positions can earn well over $170,000+.
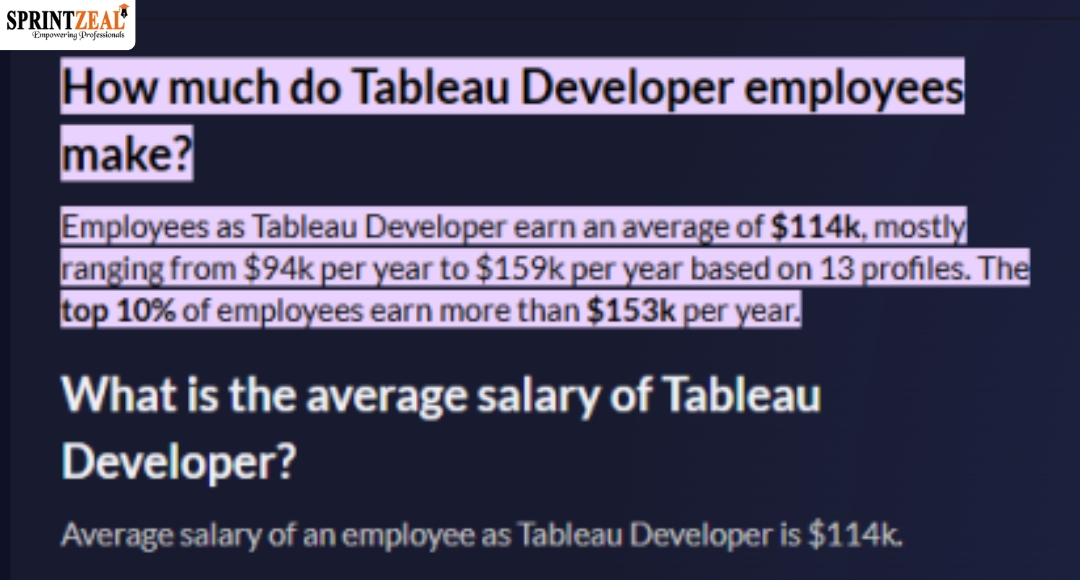
Tableau Professionals
On average, the compensation package for Tableau Developers in the USA lies in the range of $113,000 - $130,000 every year. For those in the position who perform exceedingly well, especially in terms of domain specialization, it includes $150,000 - $170,000.
Summary (US): Both of the tableau power bi jobs are financially rewarding. The Tableau jobs tend to generate salaries that are slightly higher on average in advanced analytics teams. However, demand is good for the Power BI jobs due to enterprise adoption.
Power BI Professionals
The salary range in the U.K. for a Power BI role can vary between £40,000 – £80,000+, while senior or lead roles would approach £90,000+.
Tableau professionals:
In the UK, an annual salary of £45,000 to £75,000 can generally be expected for tableau bi professionals, such as developers and analysts.
Summary (UK): Salaries are competitive, with Power BI and Tableau skilled personnel receiving similar packages, with Tableau packages possibly higher in financial and consulting-led locations.
Given that ROW comprises different markets, here is a snapshot based on prevailing BI salary trends commonly observed globally:
India
The salary range for Power BI & Tableau professionals tends to vary from ₹6 to ₹18+ LPA for mid-level professionals. For senior professionals who lead in respective domains, salaries range from ₹20 to ₹30+ LPA.
Europe, e.g. Germany
Roles in BI can generally be between €40,000 and €100,000+, depending on experience levels and specialization in specific tools.
Australia
BI experts such as those who work with Power BI and Tableau can earn between 95,000 and 170,000+.
Summary (ROW):
Though salaries are widely varied based on optimal living costs, demand, and industry, BI skills in both tableau vs power bi are generally well paid.
Moreover, Tableau provides a well-defined certification track going from Desktop Specialist to Certified Professional, which is good if you are mainly concerned with visual analytics, advanced dashboards, and interactive reporting.
Both certifications will enhance your professional reputation significantly; however, Power BI certification is generally considered easier to obtain by beginners, as it closely matches the skills of Excel and business reporting.
In terms of job search activity through LinkedIn, as of early 2025, there were over 29,000 U.S. job postings simply searching for individuals proficient in "Power BI" and approximately 23,000 searching for individuals proficient in "Tableau". Clearly, there was significant demand for Power BI versus Tableau.
Job Vacancies for Power BI Professionals on LinkedIn:
Job Vacancies for Tableau Professionals on LinkedIn:
The rate of increase in Power BI-related employment is higher compared to other yearly rates. The rate of increase in PowerBI-related employment is also higher compared to that in Tableau-related employment. The “certification request” in PowerBI is higher at ~18% compared to ~12% in Tableau.
Figures also suggest that on remote job boards, there are much more postings available for Power BI compared to Tableau roles. For instance, on Upwork, in mid-2025, there were approximately 427 Power BI gigs compared to ~163 Tableau gigs.
In terms of job opportunities, some sectors in industry breakdown are estimated to have thousands of active Power BI job openings. To provide a better understanding, previous data showed that there were over 7,600+ Power BI jobs in the U.S. market, with remote work opportunities being a big plus within this sector (~40%).
Instead of declaring a winner for Power BI vs Tableau, the real question is which one better suits your needs to attain your business objectives.
In the case of Microsoft-based companies, especially if the organization is already using Office 365, Azure, SQL Server, and Teams, Power BI would be the best option for the organization. Furthermore, the cost would also be a factor because Power BI is more suitable for scaling up with a lower cost than other tools. In addition to that, the implementation would also be easier in organizations that already heavily rely on Microsoft products. The usage would also be more intuitive for users who already understand the basics of Microsoft products in terms of reporting standards.
On the other hand, large enterprises or big data teams focused on advanced analytics and visual storytelling might favor Tableau. The strength of Tableau is in its flexible visualization engine, which provides more control over the design process as well as its capacity to accommodate varied data sets with complex analytics processes with relative ease. Large enterprises with strong analytics or data science groups tend to favor tableau bi for certain client-centric dashboards or deep data exploration.
Here is an easy way of visualizing the situation:
If your firm operates on Microsoft and prioritizes cost efficiency as well as quick adoption, then Power BI probably is the better option. On the other hand, if your analytics teams require beautiful visuals and absolute flexibility for handling complex data, Tableau is worth the purchase.
Hence, what should one opt for? For individuals who are new to the BI world or want to opt for widespread industry demand along with strong job markets, Power BI would be a good option. However, when an individual’s job revolves around data storytelling, then Tableau might prove to be a better option.
The tool of choice for your career objective, certification or formal education with Power BI or Tableau training paths, is an essential step in fast-tracking your career growth as a Business Intelligence professional. Now that you’re more ready to progress your knowledge and stand out as a leading force in the Business Intelligence industry, begin with the learning path that you wish to pursue in your data career.To follow the path, you can go for Microsft Power BI Certification and Tableau certification to land your dream job of being a data analyst .
Choosing between Power BI and Tableau is no longer just about the features. Now it’s about how well a tool fits your business environment, data complexity, and long-term goals. 2026 sees both tools continuing to dominate the BI space, but with the different audiences.
Power BI has become the first choice of almost every organization that is deeply embedded in the Microsoft ecosystem as it offers integration with Excel, Azure, and Microsoft 365 at a very competitive price. Tableau, on the other hand, is a great solution when it comes to flexibility, advanced visual analytics, and handling large, complex datasets, which is why it's a favourite in data-heavy and enterprise environments.
This article is for SMBs looking for cost-effective BI large enterprises dealing with big data and data analysts who want to improve their visualization skills. Career changers who are deciding between tableau bi or Power BI for their future job growth. You will have a practical and experienced, backed tableau power bi comparison of capabilities, strengths, and real-life examples, instead of top-level opinions.
So, which tool, really, makes sense for you in 2026? More importantly, which one fits the way you work with, analyze, and grow through the data? At the end of this guide, you will know the answer crystal clear from the marketing hype.
Power BI is a business intelligence and data visualization tool developed by Microsoft that is meant to allow businesses to turn raw data into useful insights. Fundamentally, Power BI is a tool that helps users connect different datasets, clean, and model their data before presenting it through reports and dashboards. In relation to the ongoing debate about Tableau versus Power BI, Power BI is widely preferred by teams that demand speed with minimal setup, especially when Microsoft is a driving force behind an entity.

One of the major advantages of Power BI lies in its feature set. It allows users to create highly interactive dashboards and utilize features such as real-time reporting and powerful data modeling using DAX (Data Analysis Expressions).
For more details on Data Modeling refer to this interview questions blog for more detailed analysis.
Inbuilt features such as natural language query support, automated insights, and smart visualization assist users. When comparing power bi vs tableau power bi uses, we can see that Power BI offers special importance to ease of usage and quick dashboard development. Does it make sense why finance and operations teams love Power BI so much? Among all other tableau bi tools, one reason lies in its usage.
Another area where Power BI excels is through its ecosystem. It offers a seamless integration with Microsoft 365, Excel, Azure, and SQL Server, enabling enterprises to utilize existing infrastructure with no problems at all. Unlike Tableau, which offers a wide but also complicated ecosystem, Power BI offers a connected and affordable BI solution that is also scalable for growing businesses.
Tableau is recognized as a prominent business intelligence and data visualization software that can help businesses effectively transform complex data into clear and interactive visualizations. While discussing the comparison of power BI vs Tableau, it is sometimes considered that Tableau is the top choice for those businesses that require in-depth data exploration, high-level data visualization, and many other important data-related tools.

At its core, Tableau provides a family of products that include Tableau Desktop, Tableau Server, and Tableau Cloud, which function together to provide something referred to as the analytics lifecycle. Tableau Desktop is where the analyst interacts with the data and where they create the visualizations with Tableau.Likewise, Tableau Server and Tableau Cloud make sharing the created dashboards easy and ensure that decision-makers always have the latest available information.
One of the greatest strengths of Tableau is that it has very advanced tools pertaining to visual analytics. The drag-and-drop interface offered by Tableau enables free exploration of data and allows “what-if” scenarios to be asked. This makes Tableau’s BI tool very appropriate in cases where there is a need to deal with huge data sets.
Comparing the two visualisation tools – Power BI and Tableau – generally comes down to the complexity you need versus the insights you desire.
Power BI is a much stronger choice when it comes to price. With a free version for desktop use and a relatively affordable Pro version, Power BI is perfect for new startups and mid-sized teams. Tableau BI, by contrast, is a premium business intelligence tool, which means that while it costs more, for an enterprise dealing with high volumes of data, it is worth it.
Power BI is created with the intent of fast adoption, especially if you are already familiar with Excel or other Microsoft products. Tableau Power BI comparisons will frequently point out that the learning curve for Tableau is more difficult; however, it also offers more possibilities for creative freedom to an advanced user.
Tableau BI is excellent for handling huge amounts of data and complex analytics. Power BI is also quite efficient for handling the majority of a business’s needs, though very large models may need to be fine-tuned.
Tableau's flexibility and personalization capacity for visualization and storytelling are unparalleled. Power BI emphasizes dashboards and business reporting.
Select Power BI if you want speed, cost, and Microsoft. Select Tableau if you want analysis and visualization precision. What matters most to you? Is it ease of use or analysis?
Picking one of the two usually comes down to the built in capabilities. Each product is strong but each suits a different kind of analyst and a different level of technical detail.
Power BI besides Tableau connect to SQL engines, Excel workbooks, AWS, Azure, Google BigQuery and to live streams. Power BI slips straight into a Microsoft setup - Excel, Azure SQL or SharePoint talk to it without extra steps. Tableau copes better with mixed plus very large data that sit in multiple clouds - it offers more options when the data estate is scattered.
Power BI leans on DAX, a formula language that is rich but terse - newcomers often pause before they trust it. Tableau adds calculated fields and shows the transformation on screen - the user sees the effect of each step. Decide whether you want to type formulas or to drag coloured blocks.
Either package publishes interactive charts - power BI stresses speed and a layout that a finance team can read right away. Tableau gives the designer finer control over colour, size but also sequence - a long narrative can unfold in one view. When the brief is to guide the reader through a story, Tableau offers more room to speak.
Tableau BI is priced per user, billed annually unless otherwise specified
Tableau also offers Enterprise editions with higher pricing (e.g., Creator up to $115/month) depending on scale and features
It has been found that Tableau BI tools are good at handling large volumes of complex data with live connections to technologies such as Snowflake, Redshift, and Hadoop. Power BI relies significantly on its in-memory database named VertiPaq. Thus, there is a guarantee of high performance with optimized data, while extra effort is required while working with large and unoptimized data.
Further, Power BI has strong integration with Microsoft products like Azure and SQL Server, which translates into better refresh speed during scheduled data refreshes. Tableau offers real-time connections as well as extracts. However, during complex queries or joins, the refresh speed can be affected. Both tools enjoy strong stability figures, and hence tableau power bi comparisons often draw a similar conclusion of both tools being equally reliable.
For cloud scalability, the option of dedicated capacity is available in Power BI Premium, making it easier to handle increases in user and capacity scalability across various departments. For Tableau, the options of Tableau Cloud and Server with multiple node deployment options exist, which can cater to the needs of big businesses. The key differentiation will obviously be the infrastructure, where the ‘Microsoft-first’ option will naturally choose the Power BI, while heterogeneous environments lean toward Tableau
A reason for the debate on tableau vs power bi visualization is that, essentially, both of these tools shine when it comes to the arena of visual storytelling.
Tableau BI has always been popular mainly for the ease of use of its drag, and, drop feature, coupled with very powerful visuals options. Analysts can create very complex charts easily and without any help of third, party plugins. Power BI has upgraded the competition significantly by making available very solid native visuals and even a full marketplace for custom visuals. While Tableau may be considered more flexible right from the start, Power BI gets quite close in terms of customization.
Power BI is packed with AI, powered features such as automated insights, natural language queries, and forecasting, which help to bring sophisticated analytics within the reach of non, technical users. Meanwhile, Tableau is more centered on visual exploration and providing a deeper statistical level, thus giving a skilled analyst more control.
Storytelling with Data Tableau has a unique talent for exploratory storytelling, where it interactively leads the audience through data narratives. Power BI, by and large, tends to concentrate on business reporting and executive dashboards, thus, making the insights more consumable. Comparing Power BI vs Tableau in storytelling, one may say that Tableau is more 'artistic', whereas Power BI is more 'structured'.
Ease of adoption is a key factor, particularly in the context of teams that seek to scale their analytics capabilities.
Beginner Friendliness
Power BI, in my opinion, is more accessible as a beginner's interface, especially for people who work with Excel or Microsoft software in general. It seems more intuitive and business-like in its interface. Tableau is more difficult to learn, but ultimately more flexible in its analysis once you get the hang of it.
Learning Resources & Community
Support Both tools have strong communities and learning systems. Power BI also benefits from the large Microsoft corporate ecosystem and the Microsoft Learn system, while Tableau has a very passionate global community surrounding the tool and extensive learning material concerning visualization. Skill Requirements for Professionals For professionals, BI in Tableau tends to require more analytical and visualization skills, Power BI more modeling concepts and DAX capabilities. The decision comes down to aspirations and objectives – are they purely business-focused, or is the goal more complex, advanced visualization?
Power BI has gained much popularity due to seamless integration with Microsoft applications, thus becoming an ideal choice for companies that are already invested in Office 365, Azure, and Dynamics applications. Finance teams use Power BI to perform real-time financial reporting, create budgets, and track key performance indicators (KPIs). For operations, Power BI is utilized for supply chain performance, inventory, and efficiency improvement, where dashboards are created to track various operations. Small and medium-sized companies are attracted to Power BI due to its effective cost, as it allows companies to deploy dashboards quickly without involving IT departments, thus simplifying its usability in many business environments. Moreover, companies that rely on Microsoft applications have chosen Power BI as it simplifies the process and enhances efficiency, as it has become an ideal platform for companies that are seeking consolidated information for human resources, sales, and operations, thus saving on cost and efficiency, especially for companies relying on Microsoft applications.
On the other side of the spectrum, tableau bi is often the default choice when enterprises and analytics teams value data storytelling and exploration the most. Within the industries of health care, retail analytics, and global consulting, enterprises require a high level of complex data relationships to be properly mapped out and illustrated for decision-making leadership teams. Here, in lies the benefit of the visualisation tools offered within tableau bi; enterprises that operate with a strong analytics team and require the depth of analysis within a multitude of data sources choose tableau bi due to its capability to accommodate live connections necessary within the field of data science. Thus, within the realm of large enterprise analytics solutions, tableau bi stands as a strong default solution for enterprises that value depth within ad hoc analysis and other aspects of customised exploration.
Power BI Professionals
Power BI Developers & Analysts usually earn within a yearly range of $90,000 - $150,000+, while more senior positions can earn well over $170,000+.
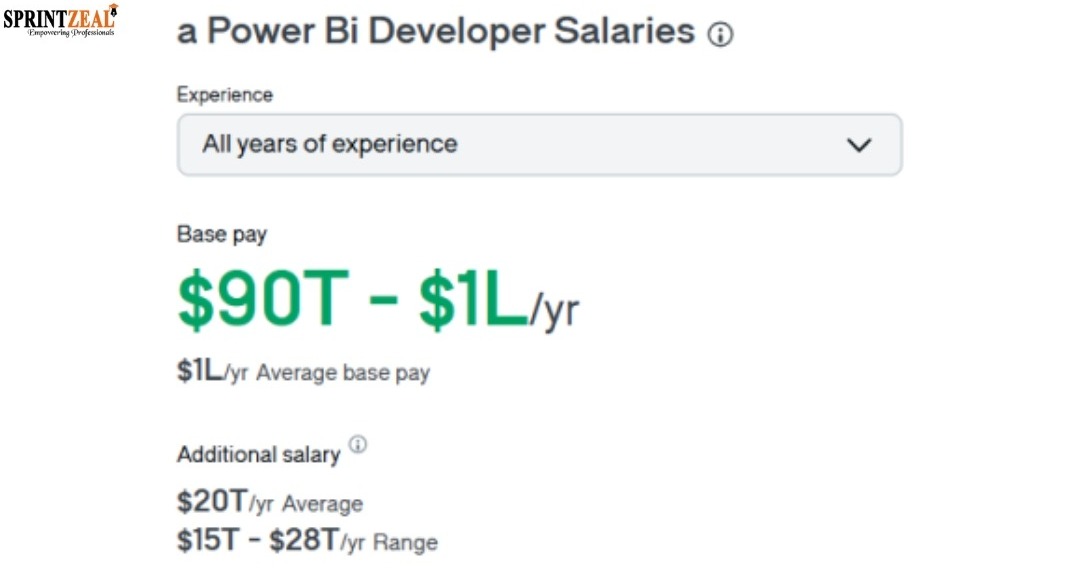
Tableau Professionals
On average, the compensation package for Tableau Developers in the USA lies in the range of $113,000 - $130,000 every year. For those in the position who perform exceedingly well, especially in terms of domain specialization, it includes $150,000 - $170,000.
Summary (US): Both of the tableau power bi jobs are financially rewarding. The Tableau jobs tend to generate salaries that are slightly higher on average in advanced analytics teams. However, demand is good for the Power BI jobs due to enterprise adoption.
Power BI Professionals
The salary range in the U.K. for a Power BI role can vary between £40,000 – £80,000+, while senior or lead roles would approach £90,000+.
Tableau professionals:
In the UK, an annual salary of £45,000 to £75,000 can generally be expected for tableau bi professionals, such as developers and analysts.
Summary (UK): Salaries are competitive, with Power BI and Tableau skilled personnel receiving similar packages, with Tableau packages possibly higher in financial and consulting-led locations.
Given that ROW comprises different markets, here is a snapshot based on prevailing BI salary trends commonly observed globally:
India
The salary range for Power BI & Tableau professionals tends to vary from ₹6 to ₹18+ LPA for mid-level professionals. For senior professionals who lead in respective domains, salaries range from ₹20 to ₹30+ LPA.
Europe, e.g. Germany
Roles in BI can generally be between €40,000 and €100,000+, depending on experience levels and specialization in specific tools.
Australia
BI experts such as those who work with Power BI and Tableau can earn between 95,000 and 170,000+.
Summary (ROW):
Though salaries are widely varied based on optimal living costs, demand, and industry, BI skills in both tableau vs power bi are generally well paid.
Moreover, Tableau provides a well-defined certification track going from Desktop Specialist to Certified Professional, which is good if you are mainly concerned with visual analytics, advanced dashboards, and interactive reporting.
Both certifications will enhance your professional reputation significantly; however, Power BI certification is generally considered easier to obtain by beginners, as it closely matches the skills of Excel and business reporting.
In terms of job search activity through LinkedIn, as of early 2025, there were over 29,000 U.S. job postings simply searching for individuals proficient in "Power BI" and approximately 23,000 searching for individuals proficient in "Tableau". Clearly, there was significant demand for Power BI versus Tableau.
Job Vacancies for Power BI Professionals on LinkedIn:

Job Vacancies for Tableau Professionals on LinkedIn:

Instead of declaring a winner for Power BI vs Tableau, the real question is which one better suits your needs to attain your business objectives.
In the case of Microsoft-based companies, especially if the organization is already using Office 365, Azure, SQL Server, and Teams, Power BI would be the best option for the organization. Furthermore, the cost would also be a factor because Power BI is more suitable for scaling up with a lower cost than other tools. In addition to that, the implementation would also be easier in organizations that already heavily rely on Microsoft products. The usage would also be more intuitive for users who already understand the basics of Microsoft products in terms of reporting standards.
On the other hand, large enterprises or big data teams focused on advanced analytics and visual storytelling might favor Tableau. The strength of Tableau is in its flexible visualization engine, which provides more control over the design process as well as its capacity to accommodate varied data sets with complex analytics processes with relative ease. Large enterprises with strong analytics or data science groups tend to favor tableau bi for certain client-centric dashboards or deep data exploration.
Here is an easy way of visualizing the situation:
If your firm operates on Microsoft and prioritizes cost efficiency as well as quick adoption, then Power BI probably is the better option. On the other hand, if your analytics teams require beautiful visuals and absolute flexibility for handling complex data, Tableau is worth the purchase.
Hence, what should one opt for? For individuals who are new to the BI world or want to opt for widespread industry demand along with strong job markets, Power BI would be a good option. However, when an individual’s job revolves around data storytelling, then Tableau might prove to be a better option.
The tool of choice for your career objective, certification or formal education with Power BI or Tableau training paths, is an essential step in fast-tracking your career growth as a Business Intelligence professional. Now that you’re more ready to progress your knowledge and stand out as a leading force in the Business Intelligence industry, begin with the learning path that you wish to pursue in your data career.To follow the path, you can go for Microsft Power BI Certification and Tableau certification to land your dream job of being a data analyst .
Mon, 13 July 2026
Fri, 10 July 2026

Fri, 10 July 2026

© 2026 Sprintzeal Americas Inc. - All Rights Reserved.